I must confess that a recession is on my mind. It is the decline in the markets coupled with the recession currently occurring in the goods producing sectors which has me looking harder for a decline in the service sector (which continues to grow). Likely, if a slowing begins in the service sector in the next few months, it is entirely possible that the recession would be marked in 4Q2015. On the other hand, if the service sector remains relatively strong - it is unlikely a recession will be seen at this time.
Follow up:
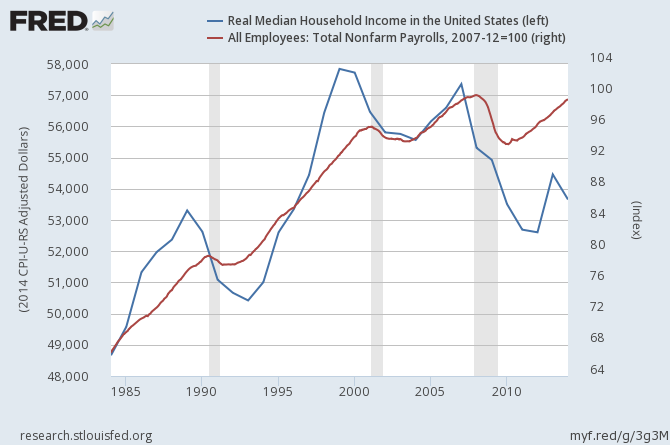
I have no love on the way the economy is measured. In business, your organization is no stronger than your weakest link. The links in the economy are people. The measurements therefore should be on the median to lowest people in the economy. The 0.1% do not need monitoring. The tools to measure would be employment and income. Employment is still recovering and is providing more and more of the population jobs - slowly but surely. Even though I have attacked the way employment is monitored, there is no argument that employment is improving (improving but at a slower pace than the rate the headlines show).
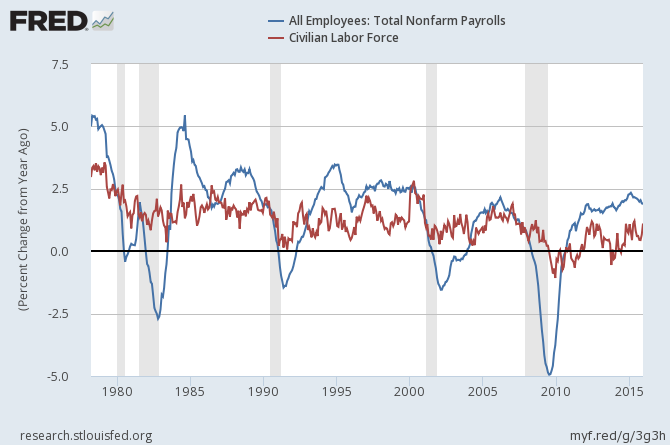
Employment growth, however, is driven by dynamics which occur months earlier - and therefore does not drive the future economy. It's an old canard that employment is a lagging indicator.So the Federal Reserve's concentration on employment as a guide when to raise the federal funds rate is misguided. As predicted, the economy was declining as the Fed adjusted the rates in December 2015. In the recent meeting statement, the Federal Open Market Committee (FOMC) did NOT continue their adjustment of the federal funds rate because "....economic growth slowed late last year." Gee, what a surprise to most except for the Federal Reserve. (Sarcasm.)
Also median inflation adjusted family income continues a slow recovery process - and is currently back to pre-Great Recession levels and within about 1% of the January 2000 level.
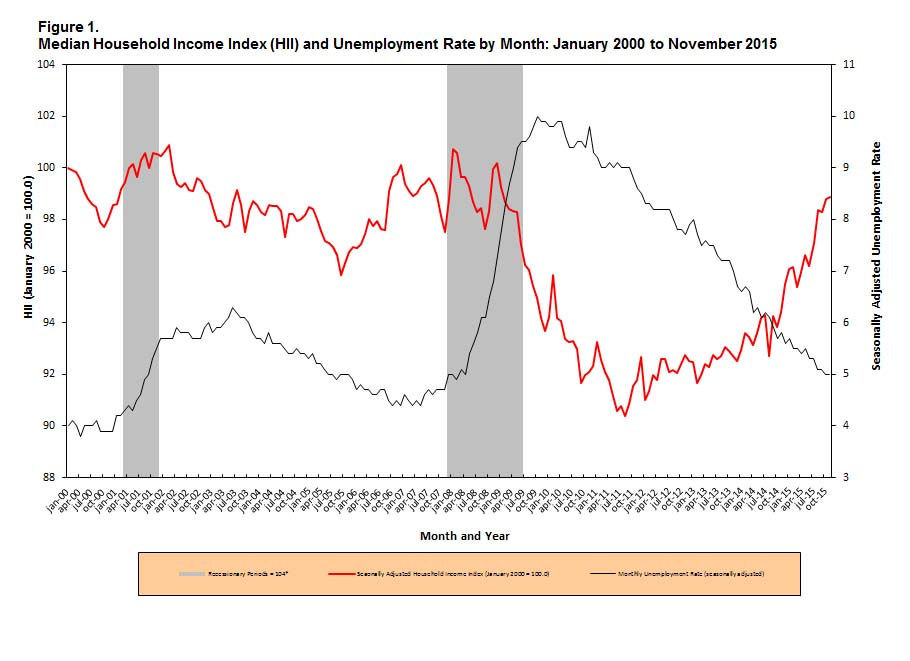
Yet, the average person likely was better off in the past.
In the USA, recessions are marked by the National Bureau of Economic Research (NBER). Sticking to the current technical recession criteria used by the NBER:
A recession is a significant decline in economic activity spread across the economy, lasting more than a few months, normally visible in real GDP, real income, employment, industrial production, and wholesale-retail sales. A recession begins just after the economy reaches a peak of activity and ends as the economy reaches its trough. Between trough and peak, the economy is in an expansion. Expansion is the normal state of the economy; most recessions are brief and they have been rare in recent decades.
….. The committee places particular emphasis on two monthly measures of activity across the entire economy: (1) personal income less transfer payments, in real terms and (2) employment. In addition, we refer to two indicators with coverage primarily of manufacturing and goods: (3) industrial production and (4) the volume of sales of the manufacturing and wholesale-retail sectors adjusted for price changes.
Below is a graph looking at the month-over-month change (note that multipliers have been used to make changes more obvious).
Month-over-Month Growth Personal Income less transfer payments (blue line), Employment (red line), Industrial Production (green line), Business Sales (orange line)
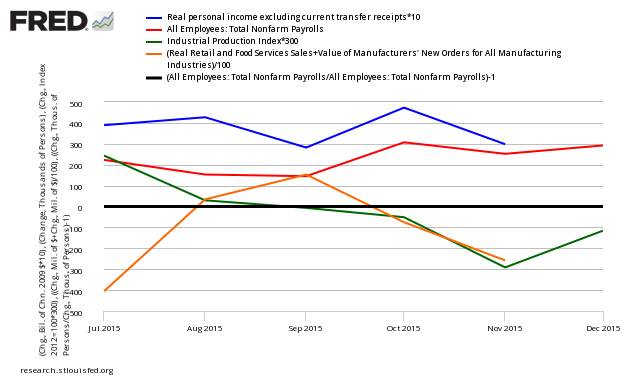
In the above graph, if a line falls below the 0 (black line) - that sector is contracting from the previous month. At his point,much of the data is soft - with business sales and industrial production in the warning zone. Again, this is a rear view mirror, subject to revision, and is not predictive of where the economy is going. Another way to look at the same data sets is in the graph below which uses indexed real values from the trough of the Great Recession.
Indexed Growth Personal Income less transfer payments (red line), Employment (green line), Industrial Production (blue line), Business Sales (orange line)
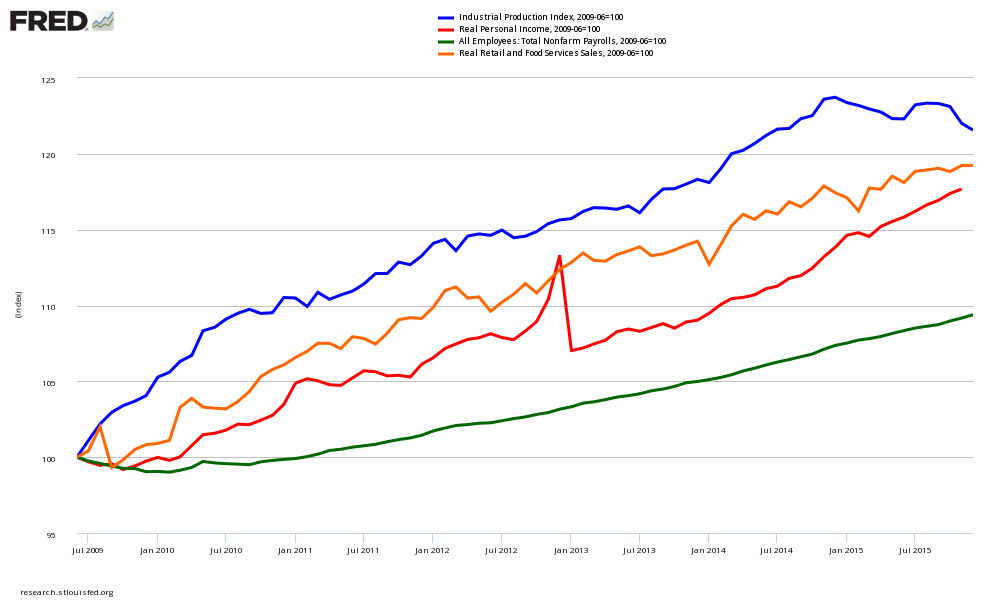
To repeat: The data sets used by the NBER to mark a recession are relatively weak with industrial production and business sales in the warning zone.
You hear economists arguing against trickle down economics. Yet, close examination of the health of the economy centers on the stock markets, total personal income (throw in the 0.1% income which distorts income measurements), industrial production, and business sales (retail plus wholesale plus industrial). This is a "rising tide lifts all ships" economic measurement - and may or may not measure the situation of the majority of the population.
Currently the majority of the population is seeing marginal economic improvements. Those old enough to remember KNOW the good 'ole days were better.
Other Economic News this Week:
The Econintersect Economic Index for February 2016 declined again, and is barely positive - and still remains at the lowest value since the end of the Great Recession. The tracked sectors of the economy which showed growth were mostly offset by the sectors in contraction. Our economic index remains in a long term decline since late 2014.
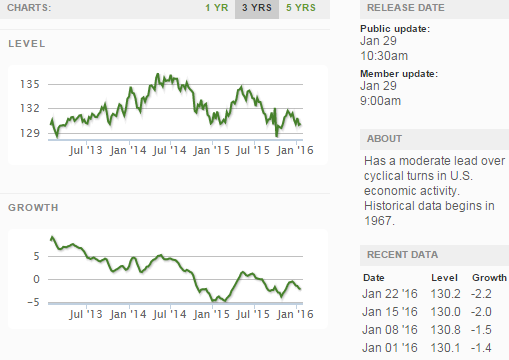
Current ECRI WLI Growth Index
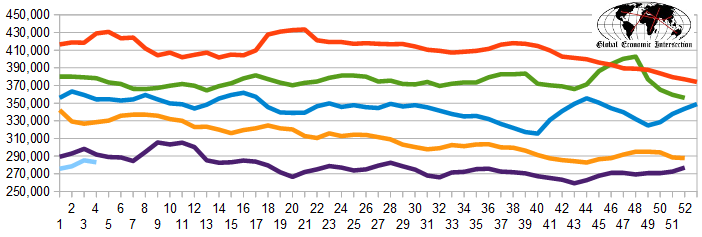
The market (from Bloomberg) was expecting the weekly initial unemployment claims at 281 K to 290 K (consensus 285,000) vs the 278,000 reported. The more important (because of the volatility in the weekly reported claims and seasonality errors in adjusting the data) 4 week moving average moved from 285,250 (reported last week as 285,000) to 283,000. The rolling averages generally have been equal to or under 300,000 since August 2014.
Weekly Initial Unemployment Claims - 4 Week Average - Seasonally Adjusted - 2011 (red line), 2012 (green line), 2013 (blue line), 2014 (orange line), 2015 (violet line)
Bankruptcies this Week: Verso, Nuo Therapeutics, Liquid Holdings Group
Click here to view the scorecard table below with active hyperlinks
Weekly Economic Release Scorecard:
