In this article I highlighted an example (please note the ruse of the word “example” and the lack of the word “recommendation”) of a”bull put credit spread” using options on ticker N:JNK, an ETF that tracks a junk bond index.
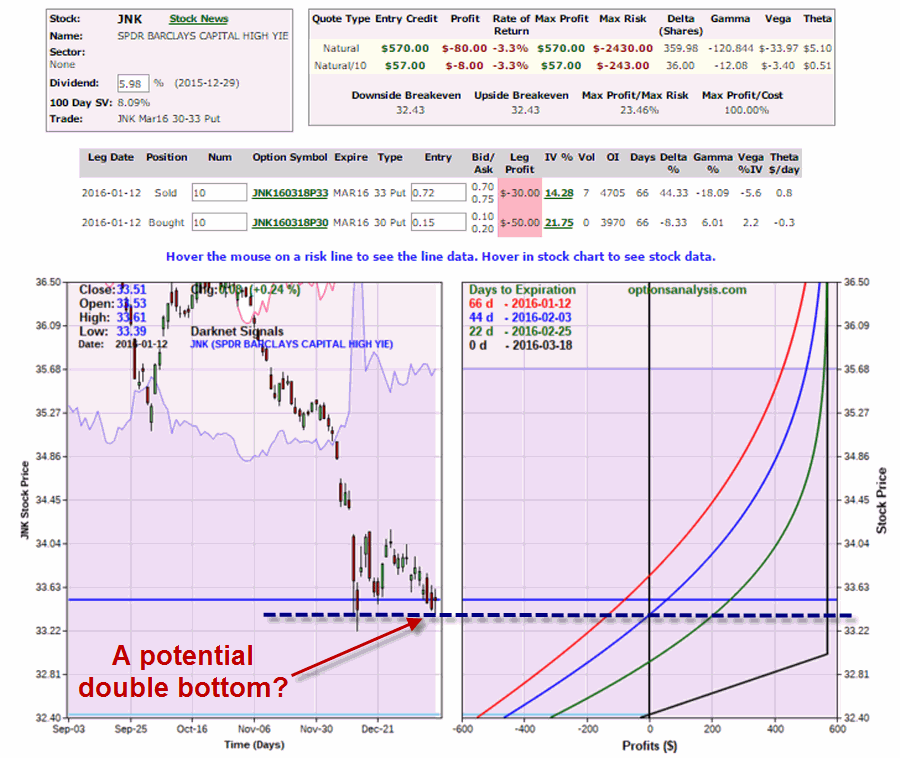
At the time of the initial example, JNK was trading at $33.51. The “catalyst” was a fairly flimsy theory that JNK could be forming “double bottom”. See Figure 1.
Figure 1 – Original JNK Bull Put Spread (Courtesy www.OptionsAnalysis.com)
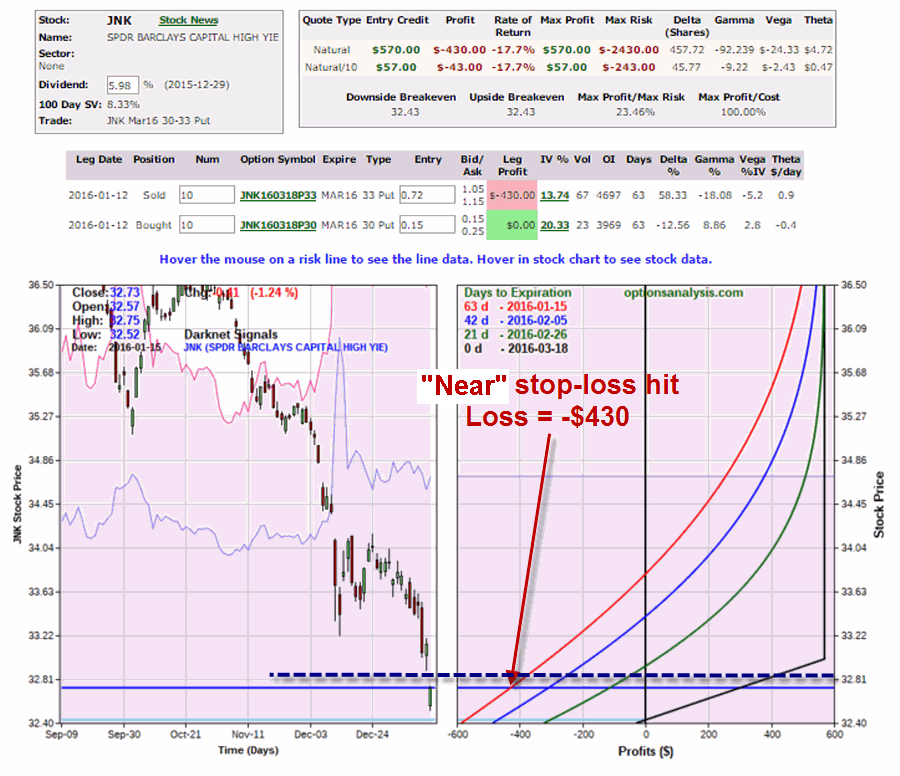
The original article discussed a near stop-loss and a far stop-loss. The near stop-loss was $32.92 which was hit after just a few days when the double bottom failed to hold. An exit there would have resulted in a loss of roughly-$430. See Figure 2.
Figure 2 – Near stop-loss hit (Courtesy www.OptionsAnalysis.com)
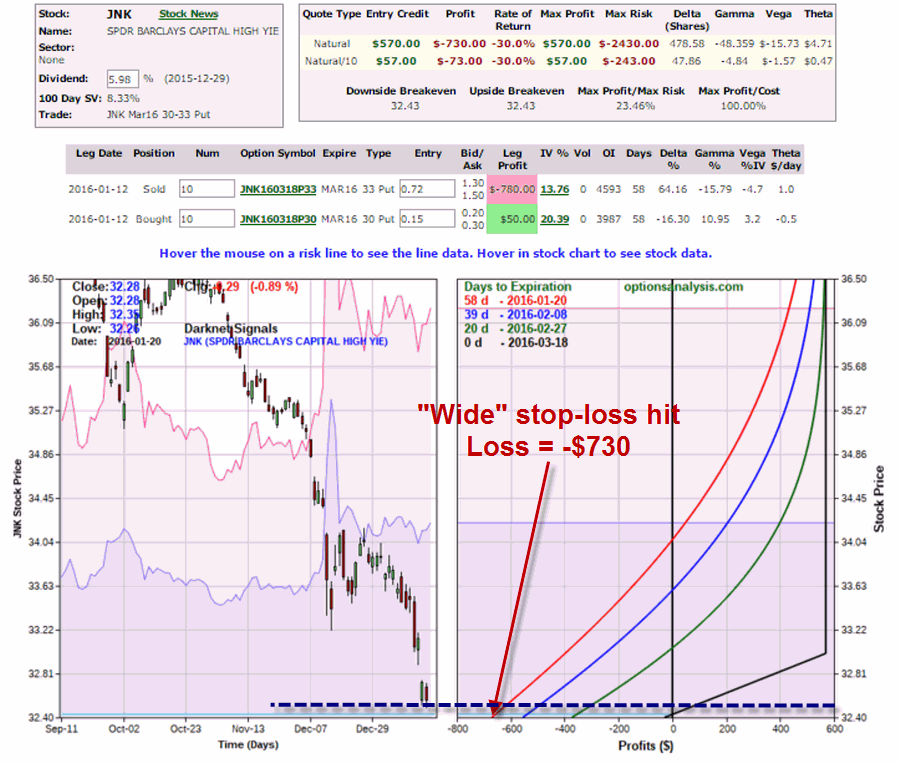
The far stop-loss was the trade’s breakeven price of $32.43. That price was hit on 1/20 and would have resulted in a loss of roughly $-730. See Figure 3.
Figure 3 – Far stop-loss hit (Courtesy www.OptionsAnalysis.com)
So What Have We Learned?
As you can see in Figure 1, 2 and 3, this hypothetical trade was a distaster pretty much from the get go. So what have we learned? A few possibilities come to mind. We learned:
*What a bull put credit spread is and how it works.
*The importance of determining in advance at what point you will exit a trade and the importance of sticking to your trading plan.
We may also have learned that a bull put credit spread is a decent strategy for playing a “potential double bottom” if one is so inclined. But perhaps we also learned that relying on “potential double bottoms” as a trading catalyst –particularly in the face of a sharply declining market – may not be the best trading idea in the world


