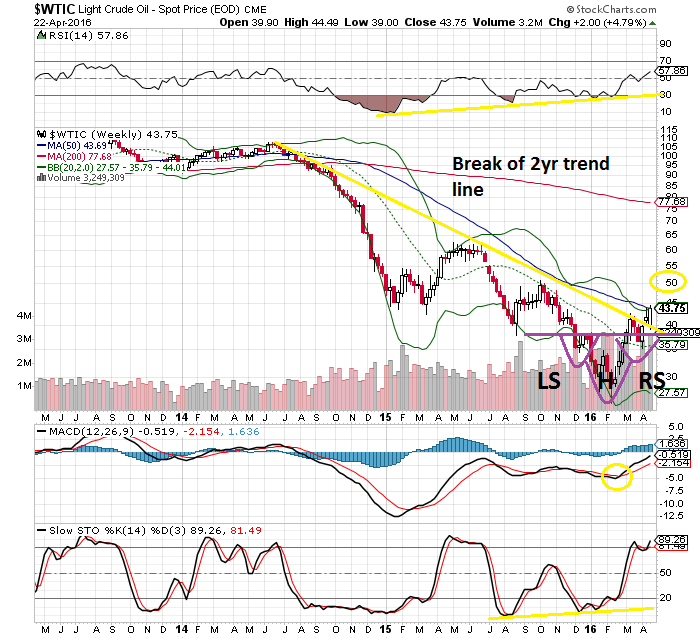
One of the things I like about posts like the Chart of the Week is that it gets people to think, share and collaborate. It can be a bit of an echo chamber sometimes, so we welcome other opinions and feedback about our work. This chart of the week comes from reader Bradley Parkes, former investment banker and current geologist (check out his website; a most interesting resume. He has a blog too).

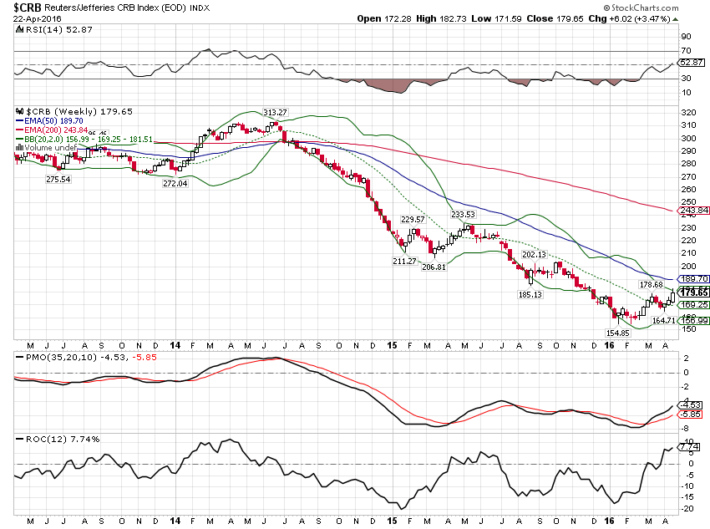
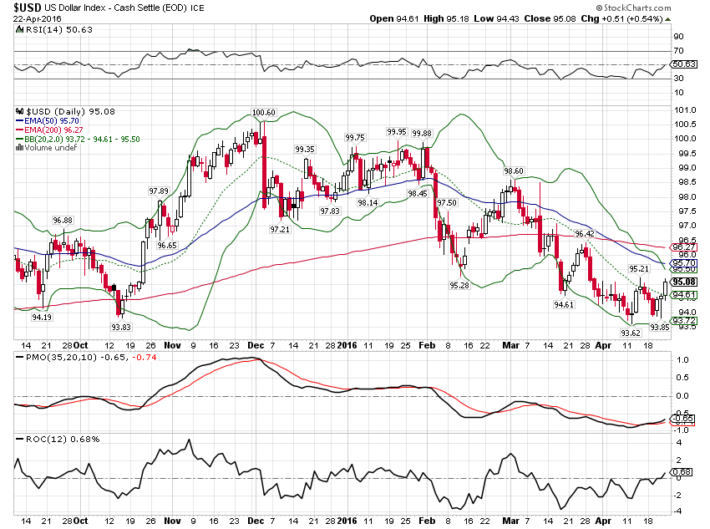
My comments: That’s not quite a completed classic inverted head and shoulders pattern. To really get moving we need to get above that 50 level Bradley’s circled. It is a little overbought here, but any pullback should be contained in the mid 30s. It is more than a little interesting that the commodity bear market appears to be coming to an end. I would still think though, as I’ve said a few times recently, that a continuation is at least partially dependent on a continued decline in the dollar. And the dollar index just can’t seem to break support. I suspect we’re going to get a correction in this commodity trend to shake out weak hands. A countertrend rally in the dollar that fails around 96 ought to do the trick. There are some major implications for asset allocation if the dollar does break down and commodities start a bull run.


