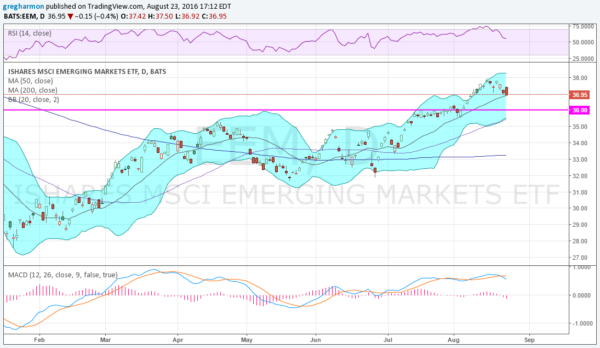
Emerging Markets (via iShares MSCI Emerging Markets (NYSE:EEM)) have been a popular place to put money in 2016. And over the last 7 months it has paid well to do so.
They have risen over 32% since the January low. The last month of that run higher also brought the Emerging market ETF back into a very long term support/resistance zone. The bottom of this range is marked by the purple line in the chart below.
With all of the excitement though Emerging Markets are now starting to look a bit tired. Notice the RSI has turned lower and the MACD has crossed down.
Weakening momentum, although both are still in the bullish range. The price action has been to the downside since late last week. And Tuesday’s candle suggests more to come. It was a bearish engulfing candle, that closed at the low, and nearly a Marubozu.

All that means that Tuesday’s price action was bearish and to such an extent that you had better be prepared for more downside Wednesday. The rising 20 day SMA, splitting the blue volatility zone, may be the key.
This line has acted as support since the beginning of July. If it holds over that line Wednesday then a reversal higher gains in the odds. If it is broken watch for a possible support at 36 and 35.50. It can get ugly if it moves below there.
DISCLAIMER: The information in this blog post represents my own opinions and does not contain a recommendation for any particular security or investment. I or my affiliates may hold positions or other interests in securities mentioned in the Blog, please see my Disclaimer page for my full disclaimer.
