Supply and demand – it determines Oil markets and essentially price. So in the long run, we should expect to see global growth increasing and prices rising in accordance. The reality can be a little more different though when it comes to the technical aspect of markets, and the day to day activity of traders.
Demand is expected to be strong this year, with the IMF predicting that global growth will reach 3.7% this year and then 3.9% in the subsequent year. However, countering this is the fact that Oil markets themselves are receiving an influx of extra supply as U.S. shale reserves come into fruition, and as the rush to extract more oil than ever transpires across the United States.
This boom has helped turn the U.S from an importer into a net exporter; something that has not happened for 25 years. All in all,it's creating a boom for the economy of the U.S - especially within its Oil industry.
Supply and demand seems to be equalling out instead of the usual over demand that many have been predicting in Oil markets. Markets now agree on this point that oversupply may actually become an issue with fracking and accordingly, we can see that Oil future prices are showing a decreasing outlook for prices.
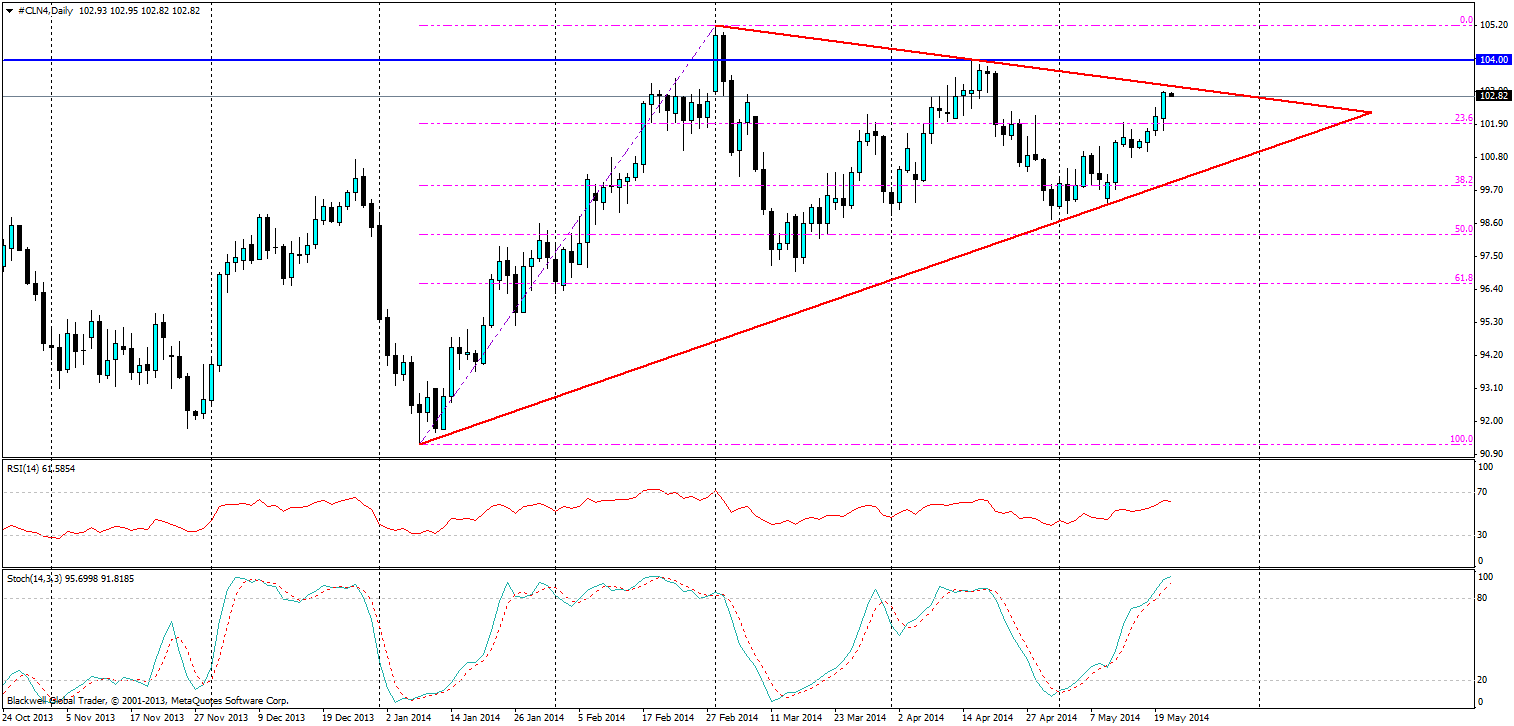
Despite these facts, in recent days, Oil prices have risen and touched 102.99. The 103 level is proving to be a heavy psychological barrier for market traders.

It is clear on the chartsthat there is a pennant in play as we have two very strong trend lines converging and the effects could be highly interesting.
Markets have thus far been uneasy about higher highs and trending upwards. While it certainly has looked like a solid uptrend on the charts with the bullish trend line, it’s beginning to get weaker and weaker as time goes on. I say this because we now have a downward trending line which is pushing the market tightly togetherwhich in turn has created the pennant pattern that we see on the charts.
Looking forward, the future remains a little cloudy. However, it looks likely that a fall lower could certainly be on the cards if movements continue in the current pattern. A breakout from the pennant would be a surprise but a possibility nevertheless. In the case of such a breakout, I would look to target key areas; with the 104.00 level being the primary target for a confirmation to enter. Any touch/push through on this level would indicate a strong buying presence in the market place.
The reality, though, seems to be more focused on a pullback in the short term: RSI and Stoch are starting to show movement towards the sell side and there is no reason to see any movement in the opposite direction. The current fib levels may act as weak support but are unlikely to hold given the past breakouts and lack of thought given by other traders when smashing through them.
While markets may have been a little weak in the past for Oil, it certainly looks like it's picking up and we could see further opportunities. Watching Oil can be tough at times, but when patterns do present themselves, it is time to take advantage.
