 If you’ve held a position in the biotech sector over the last few years, it may have felt like you were on a roller coaster. Fortunately, this is one coaster that’s well worth the ride.
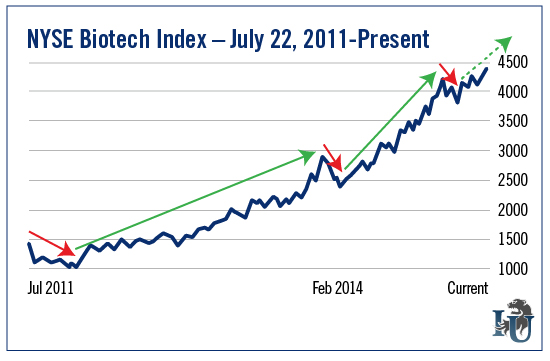
This week’s chart looks at the performance of the NYSE Biotech Index (NYSE: BTK) since July 2011. As you can see, biotech stocks have seen plenty of volatility. But any big drops were more than made up for by even bigger uptrends.
For example...
Starting at the left in today’s chart, from July 2011 to November 2011 the sector saw a 45% drop. This was followed by a 2 1/2-year bull run that ended with a gain of 194%.
Then, between February 2014 and April 2014, the sector saw a 19.6% drop. After that came a 79% charge that ended in March 2015.
From there to April 2015, biotech suffered another 11.3% drop. But in the four months since, we have started on the next uptrend...
So far, the sector has already rebounded almost 7.5%. That’s including the slight downtrend we’ve experienced over the past few weeks.
Has it been a wild ride? Certainly. But as you can see, it’s also been an incredibly profitable one.
Since July 2011, biotech has shot up more than 177%.
Healthcare analyst and Chief Income Strategist Marc Lichtenfeld commented on the uptrend in a recent article for Investment U. In his words, “this is about as strong and perfect of a trend as you’ll see... And it suggests we should see higher prices for the foreseeable future.”
Subscribers of Marc’s healthcare-based trading service Lightning Trend Trader are sure glad they banked on this trend. In recent months, his recommended plays have generated 59.59% on Auxilium Pharmaceuticals... 61.75% on Synergy Pharmaceuticals (Nasdaq: SGYP)... and a whopping 111.77% on Pharmacyclics (Nasdaq: PCYC).
Biotech has its risks, sure. And as you’ve seen, it can be very volatile. But in today’s markets, you’d be hard-pressed to find a sector that can generate such extraordinary returns in short periods of time.
