In the framework of government policy, there is enormous interest in relating the specific condition of any economy to how the government must respond to it. This, of course, presupposes that this is the case, that there must be some impartial body or official standing between what would otherwise be free market excesses. The entire literature devoted to answering the Great Depression can be summarized along these lines. But at what point can anyone determine excesses?
If the topic is asset prices, there is no mainstream discussion. Officially, asset bubbles don’t exist and really can’t under rational expectations theory. Therefore, we are left with government agencies limited to consumer prices as their policy measure. Since consumer price inflation is, as Milton Friedman showed, always and everywhere a monetary phenomenon it has been a study attributable to central banking.
The way in which it works in the mainstream of economics is NAIRU. This is the Non-Accelerating Inflation Rate of Unemployment, that magical spot on the Phillips Curve where unemployment starts to generate wage and therefore general price inflation. This would define the economy’s point of “full employment.” But one of the primary innovations coming out of the 1970’s, by cascade of global monetary mistakes, was that there may be no single Phillips Curve equilibrium. That was Milton Friedman’s whole point, as he came up with a more dynamic “natural” employment rate (to be clear, Friedman used the word “natural” to simply mean non-policy).
Structural factors change what became known as the “inflation barrier”, the actual cross where if the unemployment rate falls below inflation starts to rise precipitously. Almost all of the post-Great Inflation academic world has been dedicated to using theories about the 1930’s in order to make sure whichever economy does not run afoul of this natural obstruction.
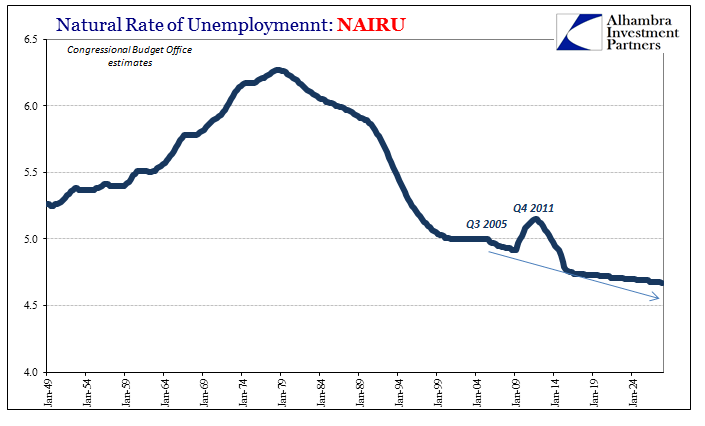
NAIRU has been refined over the decades to better reflect the possibilities for structural economic shifts, both positive and negative. The more modern version, TV-NAIRU (for Time-Varying), introduced the concept of the “Triangle Model” incorporating both supply and demand as well as what Robert Gordon called in his 1997 paper “inertia.”
The inflation process in the United States is one of the most important macroeconomic phenomena in the world, but it is also one of the best understood. In contrast to the wild gyrations of inflation in many other countries, the U. S. inflation process is dominated by inertia. Inflation changes little from year to year, and any deviation of the actual unemployment rate from the NAIRU has extremely small consequences in the short run.
This is true, by and large, as inflation in the US compared to many other places has been largely stable. This does not mean, however, it has been well-behaved, particularly following events in 2011. As you can see on the chart above, the “hump” for NAIRU peaks unsurprisingly at Q4 2011.
Inertia is really another way of incorporating expectations as part of the root inflation paradigm. We know that they are a very important aspect of economic formation, as that was much of the Great Inflation in a nutshell. People do react to perceptions of future conditions in the present time. The question after 2011 seems to surround “rationality”; for policymakers, economic behavior seems to be irrational when for economic agents it might be instead policymakers who have been that.
Take the condition of the unemployment rate over the last three years. Starting around 2014, it began to fall precipitously but largely due to the lack of participation. The labor force grew very little despite BLS estimates that it was “the best jobs market in decades.” Other economic accounts registered far less economic “improvement”, suggesting at the very least more caution than what might have been presented by the BLS figures alone.
But given the prominence of NAIRU in especially monetary policy, there was bound to be a collision. By early 2015, the unemployment rate had fallen close to the Fed’s estimates for it (represented by their modeled “central tendency” for long run unemployment). No matter how low the rate has fallen since, there has been no detectable acceleration in wages, meaning that even at 4.3% it cannot be that the economy has yet found the so-called inflation barrier.
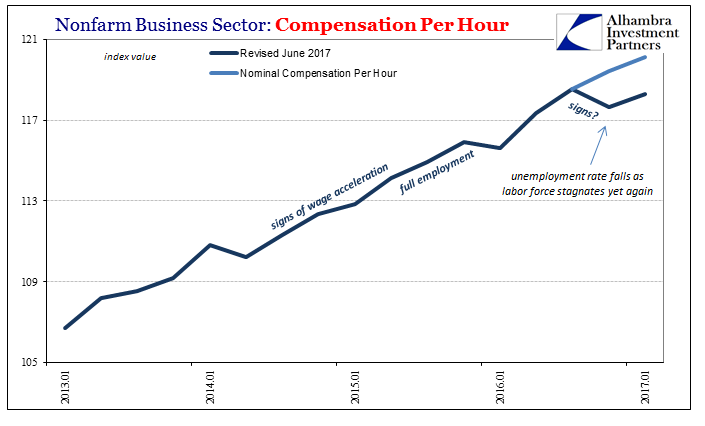
Wage statistics released today highlight this “irrational” occurrence. Estimates of nominal (as well as real) compensation rates per hour were revised sharply lower for both Q4 2016 as well as Q1 2017. This despite policymakers who claim still to see “signs” of wage acceleration perhaps in the passing clouds because they are clearly absent in all these statistics.
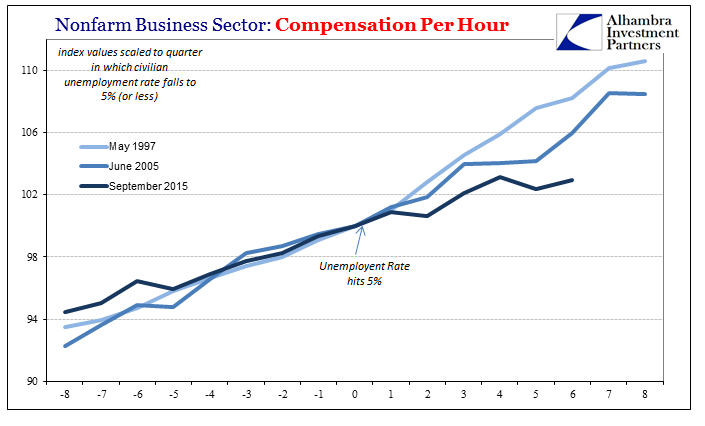
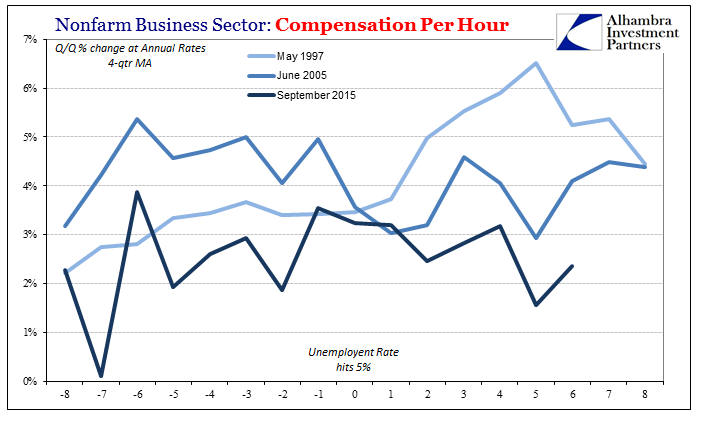
If we examine the past two periods where the unemployment rate has hit 5%, we do find evidence of wage acceleration in only one of them – the late 1990’s, specifically May 1997. There is clear wage acceleration right around the point where the unemployment rate eclipses NAIRU (around 5.10% according to the CBO).
For the latter two periods, including the current one, the evidence does suggest some degree of falling NAIRU. The unemployment rate does trend lower without sparking wage inflation. But at what point do we run into a NAIRU barrier?
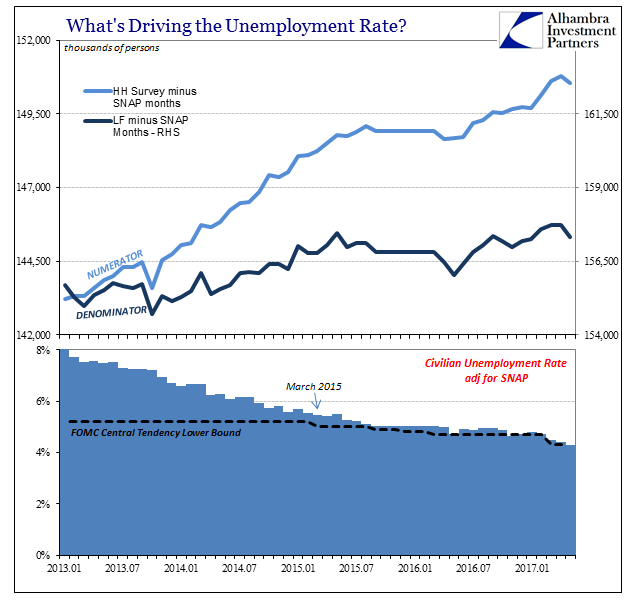
If the unemployment rate keeps on going all the way to 3% without triggering the inflation barrier, does that mean NAIRU is 2.9%? Or might it indicate instead the possibility the unemployment rate is itself faulty? The implications of the latter are much more severe, which is why they are always avoided (drug addicts, Baby Boomers).
Given inflation expectations derived from either markets or consumer surveys, inertia is a fair complaint and a relevant one arrived at in light of the failures of four successive QE’s to spark anything. Even still, we have to recognize that inflation might no longer be so stable in the US, with a deflationary or disinflationary trend that in the end must be related to something. Inertia in terms of expectations would be a hard upward barrier where in general economic agents look at monetary conditions as being “tight.”
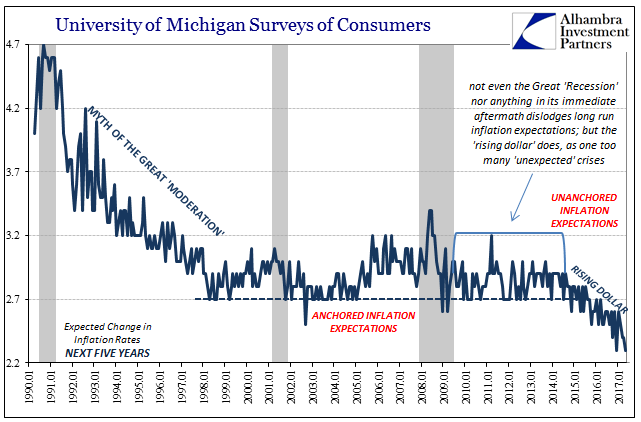
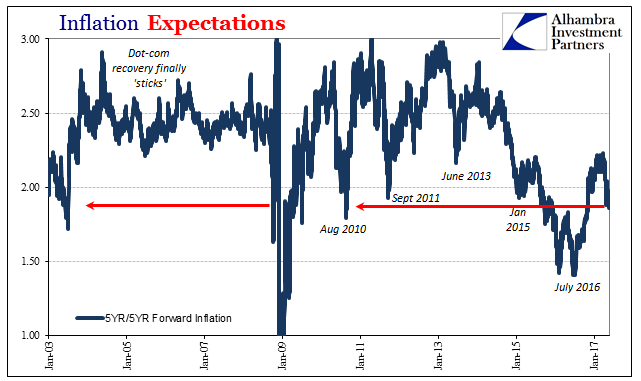
In the late nineties it was common to believe in Alan Greenspan and the magic of quarter point federal funds adjustments that had led to a new permanent plateau of prosperity. Had that actually been the case, NAIRU would have dropped precipitously at that time, since higher rates of productivity would have meant a lower inflation barrier for unemployment; the best of all worlds (which is what dot-com valuations were directly betting upon). But now we have the possibility of an extremely low NAIRU presented before us with persistently low and often negative productivity. “Something” is clearly wrong.
If we accept that the unemployment rate reflects only a part of the economy, a shrunken part, these “aberrations” are easily explained. This is more than just the usual labor force problems, as even the U-6 rate isn’t really out of historical alignment (currently it is 8.4%, less than the 9.0% from June 2005 and 8.8% in May 1997). It is the participation problem that suggests a direct monetary link via the time periods in which the shrinking occurred (to some degree in the middle 2000’s, but to an enormous disparity late in 2008 when the world was gripped by nothing but “irrational” money).
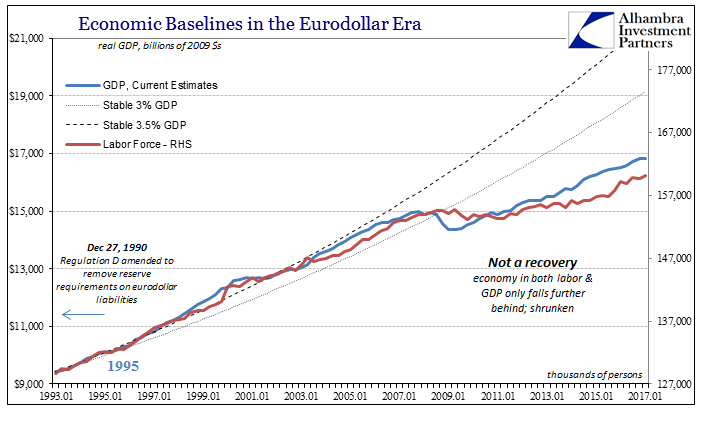
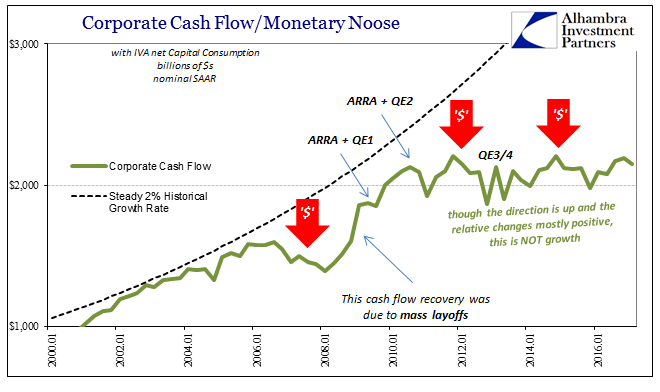
That would mean any inflation barrier is not embedded within the unemployment rate at all, but rather by what is not in the unemployment rate. And if inflation is a monetary phenomenon, then monetary conditions must be there, too.
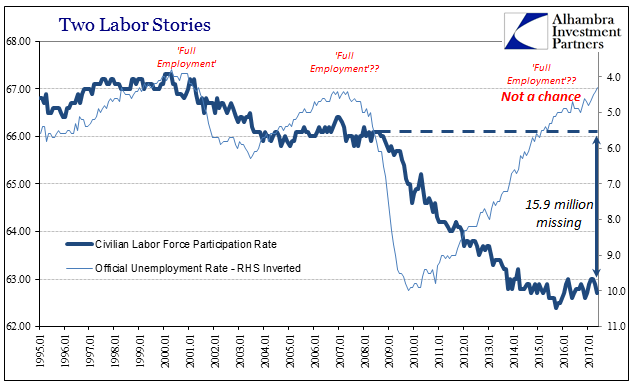
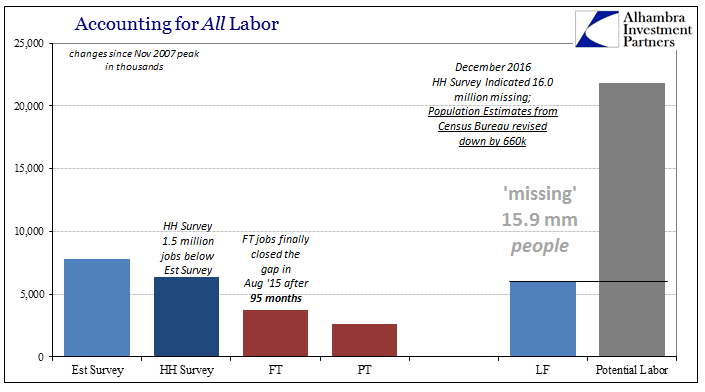
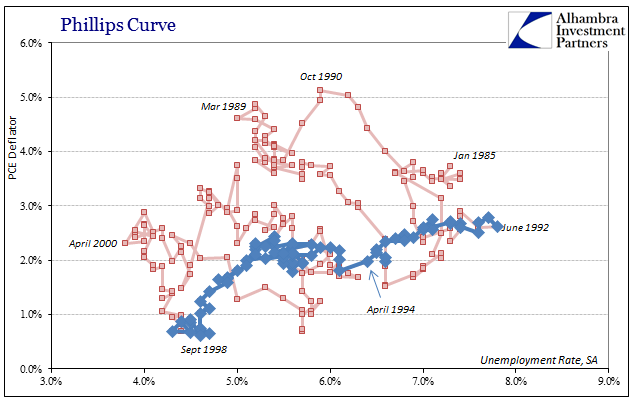
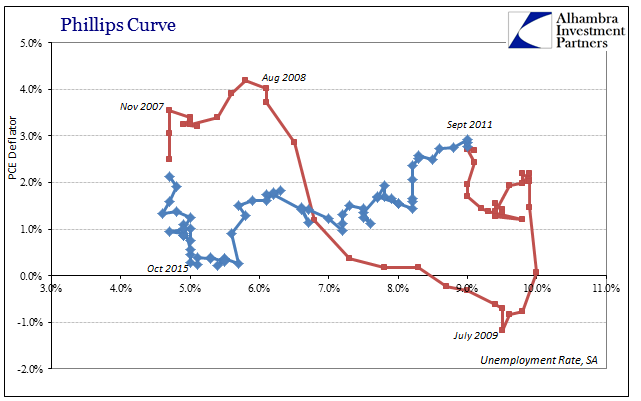
What would happen if the inflation barrier describing full employment or its natural rate jumped statistics? The result would likely be persistently confused economists who by conventional NAIRU would keep expecting one thing that isn’t actually possible. The CBO currently estimates NAIRU at 4.67%…for 2027.
There are short run relationships between inflation and unemployment, but economics often can’t explain why in the long run Phillips Curve moves around so drastically the way it does. The emphasis on theoretically describing the Great Inflation was in one sense a means to avoid having to do so, to incorporate what was in the 1970’s called “missing money” without ever factoring what was actually missing.
The “missing” 15.9 million potential workers in 2017 are as the 21st century’s “missing money.”
TL/DR: tight/unstable money => less demand => less working => liquidity preferences => supply factors => higher inertia => NAIRU that can’t be described by the current unemployment rate. They really don’t know what they are doing.
