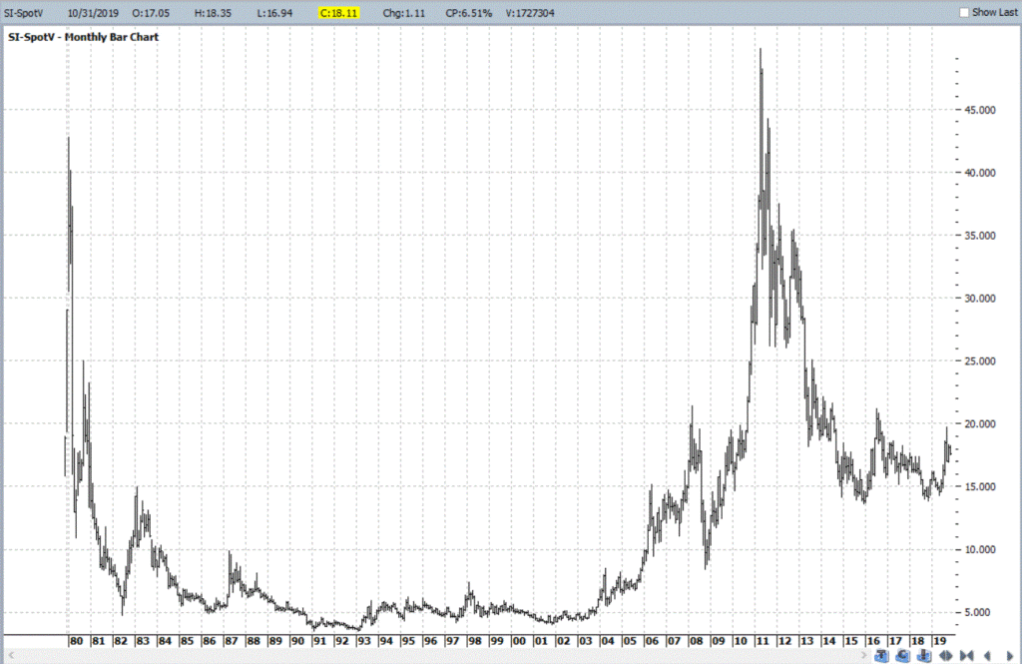
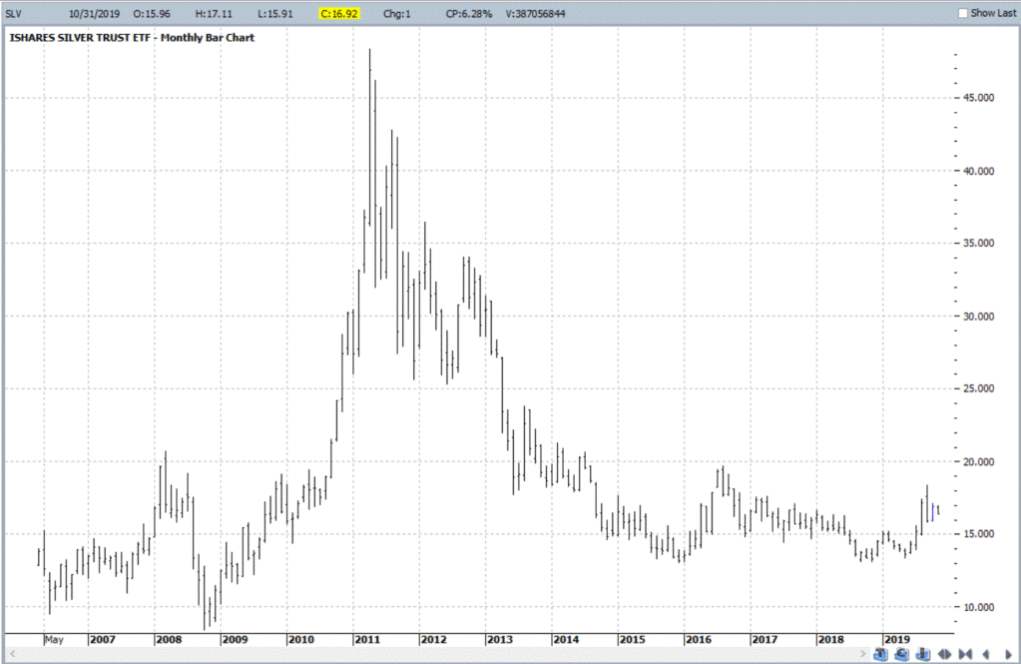
It is impossible to be in this business and avoid the hype about how silver is “poised” to “explode” to “massive new highs”, ala the great spikes in 1980 or 2011 when silver rallied to, well, massive new highs.
And it all sounds exactly like hype and pretty far-fetched at times. Still – it has happened twice before. So anything is possible. The next question then is “what to do about it, if anything?”
Figure 1 displays a monthly chart for silver futures going back to the 1980’s and Figure 2 displays a monthly chart for ticker iShares Silver (NYSE:SLV) – an ETF that tracks the price of silver bullion.

Figure 1 – Silver futures monthly Courtesy ProfitSource by HUBB

Figure 2 – ETF ticker SLV Courtesy ProfitSource by HUBB
Sounds like a sucker bet, right? And besides, what if I place a big bet on silver soaring and it tanks instead? Yeah, on the face it, it all seems like a pretty silly idea.
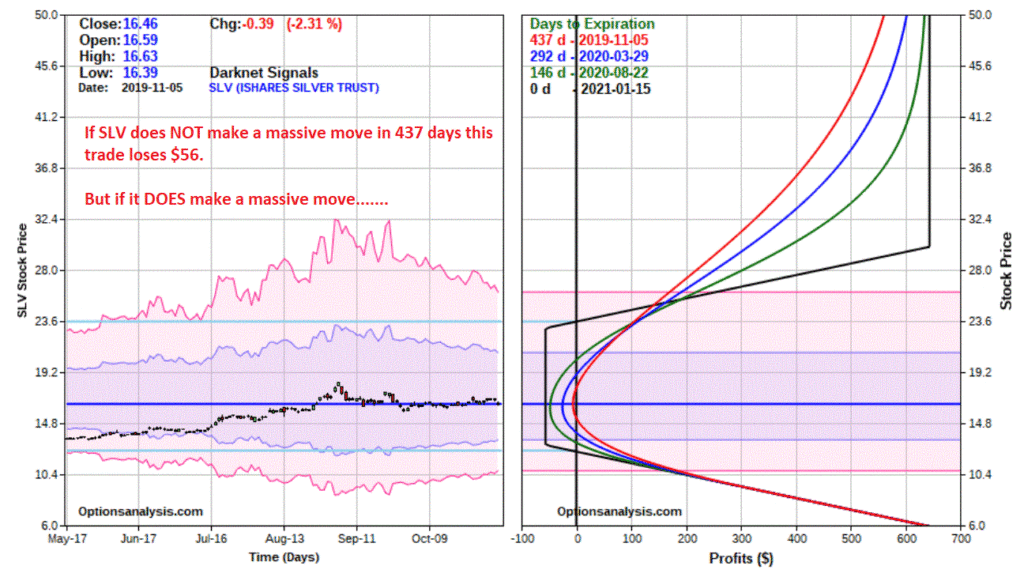
But here’s a question to ponder: What if you could risk $56 just on the off chance that silver makes a seriously large move – either up OR down – between now and January of 2021? Is that worth considering?
Well, that’s not for me to say. But let me show you what I am talking about.


SLV Example
Figures 3 and 4 displays the particulars and risk curves for a trade using options on ticker SLV as follows:*Buy 1 Jan2021 SLV 23 call @ $0.62*Sell 1 Jan2021 SLV 30 call @ $0.30*Buy 1 Jan2021 SLV 13 put @ $0.24Figure 3 – SLV option trade details Courtesy OptionsAnalysis.comFigure 4 – SLV option trade risk curves Courtesy OptionsAnalysis.comThe total cost to enter this position is a whopping $56. So, what do you get for your $56? *If SLV makes a 2-standard deviation price move sometime in the next 437 calendar days and rises to $26.40, the position will show an open profit of between roughly $175 (+212%) and $260 (+364%), depending on how soon it gets there and implied volatility at the time.*If SLV rises all the way to its old high of $48.35 the profit would be somewhere between $550 (+882%) and $644 +(1,086%).On the downside:*If SLV falls 2 standard deviations to $10.82 the position will show an open profit of between roughly $170 (+206%) and $190 (+239%) – again, depending on how soon it gets there.*And if SLV falls all the way to its 2008 low of $8.45, the position will show a profit of roughly $400 (+614%).REMINDER: I am NOT “recommending” this trade. The purpose of this example is simply to highlight the fact that options can allow a trader to “risk a little for the potential to make alot.” Nothing more, nothing less.Summary
So, is silver likely to make an astronomical move – up or down – between now and January 2021? It beats me. The only question a trader can answer with any certainty is – are you willing to risk $56 while you wait to find out?
