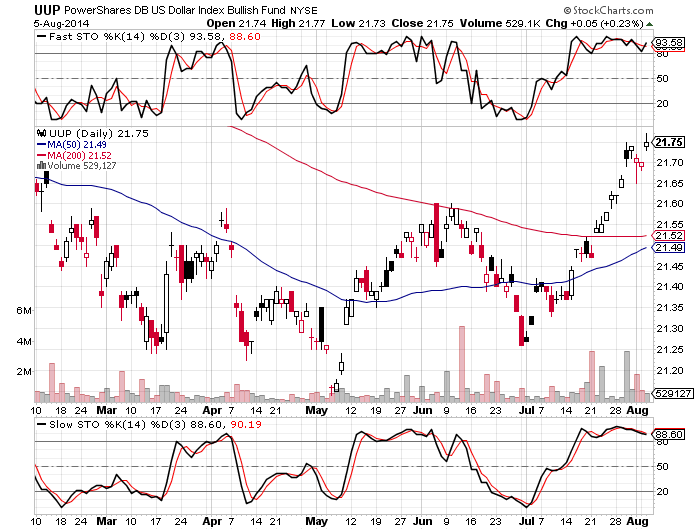
This month's weekend report expressed the view that the 200-day MA would not be broken,and that the low would be only slightly below Friday's close. After today's market action, I reaffirm those views. The insightfulness of the Poles' military analytic abilities aside, the idea that a significant decline today was because of the news of their analyses smells like a set-up for a low. After all, it would/will be easy to use related news to explain a countertrend rally, citing the "more important" favourable earnings news background (while also citing a minor abatement on the Uke front). Of course, rookies know (or should) that earnings are strongest after the peak, making now a time to discount slowing earnings, therefore, and suffer falling multiples. Therein lies both the loss of any positive leverage stemming from favourable earnings...and the rub.
Bad news is bad news, and good news is ignored in favour of bad news. Such are bear markets.
Regarding targets, yesterday's numbers are unchanged. So, let us look at the 6-month Dow chart. The red line is the 200-day MA. (The 50-day MS (blue line) will act as a magnet for the countertrend rally.
6-month Dow chart
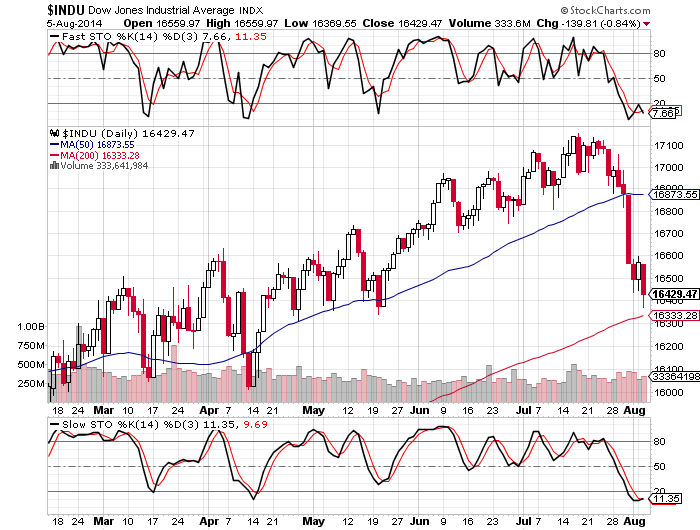
The slow and fast stochastic are oversold, including potentially completed Elliott patterns.
The latter analysis is unconventional and should be taken with a grain of salt, but it is true nonetheless to say that these momentum indicators are positioned in a manner that is consistent with a market readying to bounce.
PMs
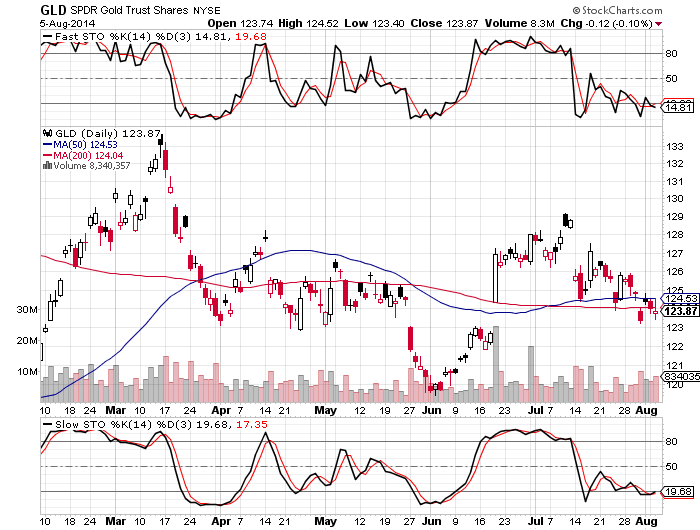
The only good thing that could be said about today's action in the PMs is that the SPDR Gold Trust,ד (ARCA:GLD) fast stochastic maintained its bullish divergence.
Both the slow and fast stochastic have all but completed their declines, using Elliott analysis; again, it is not conventional analysis to use Elliott in this manner. Most importantly, we note the divergence between gold and silver today (Tuesday). The GLD 6-month chart follows immediately below:
GLD 6-month chart
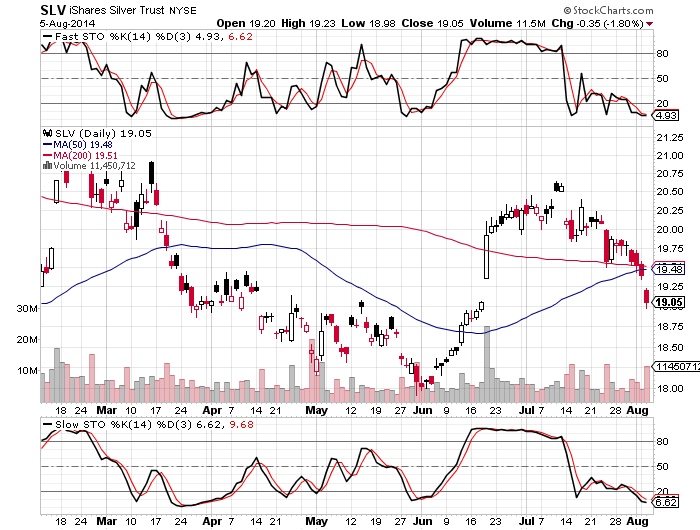
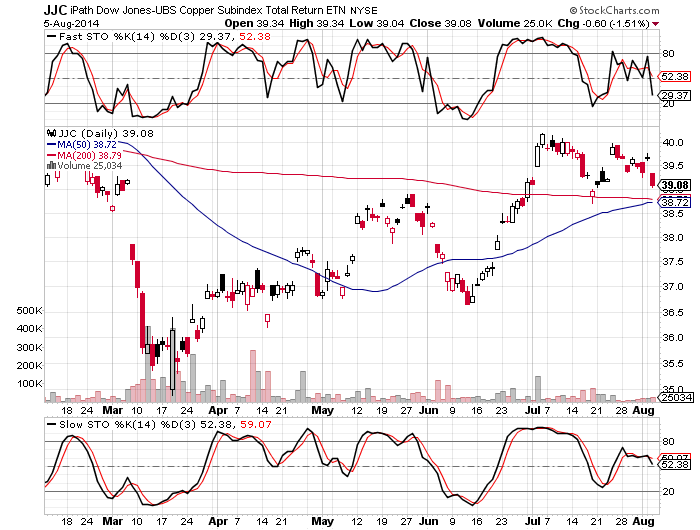
After today, we are hoping that silver takes its lead from gold, as opposed to the other way around. The 6-month SLV chart is followed by the 6-month JJC chart,so as to reflect "Dr. Copper's" own bad day.
Simply, silver traded as an industrial metal on a day that the market was down sharply. There are growing concerns regarding questionable economic fundamentals over the longer term, particularly when taking a global perspective.
The weekend report discussed a flush-out by today, if one were to occur, and now we'll see the strength of the $19 support level (I had believed that the $19.30 gap zone would hold).
If gold hold holds, forget copper and any related considerations!
Following up on yesterday's commentary, a decline this week would roll over both the 200 and 50-day MAs. However, a reversal tomorrow would take the momentum indicators back up, perhaps creating the Golden Cross discussed in this month's report.
iShares Silver Trust (ARCA:SLV) 6-month chart
iPath DJ-UBS Copper Subindex TR (NYSE:JJC) 6-month chart
Also discussed yesterday was the likelihood of the Dollar's slow stochastic likely having seen its high.
However, I pointed out that a final price high has, to-date, tended to be made on a stochastic divergence.
Today's high may conceivably have been it. If so, a positive currency driver for the PMs could present itself, as well.
PowerShares db USD Index Bullish (NYSE:UUP) 6-month chart
