Here's the video with my currency predictions for 2015 made back in January. In this article I am going through all of them and see how it matches up with markets at the moment. 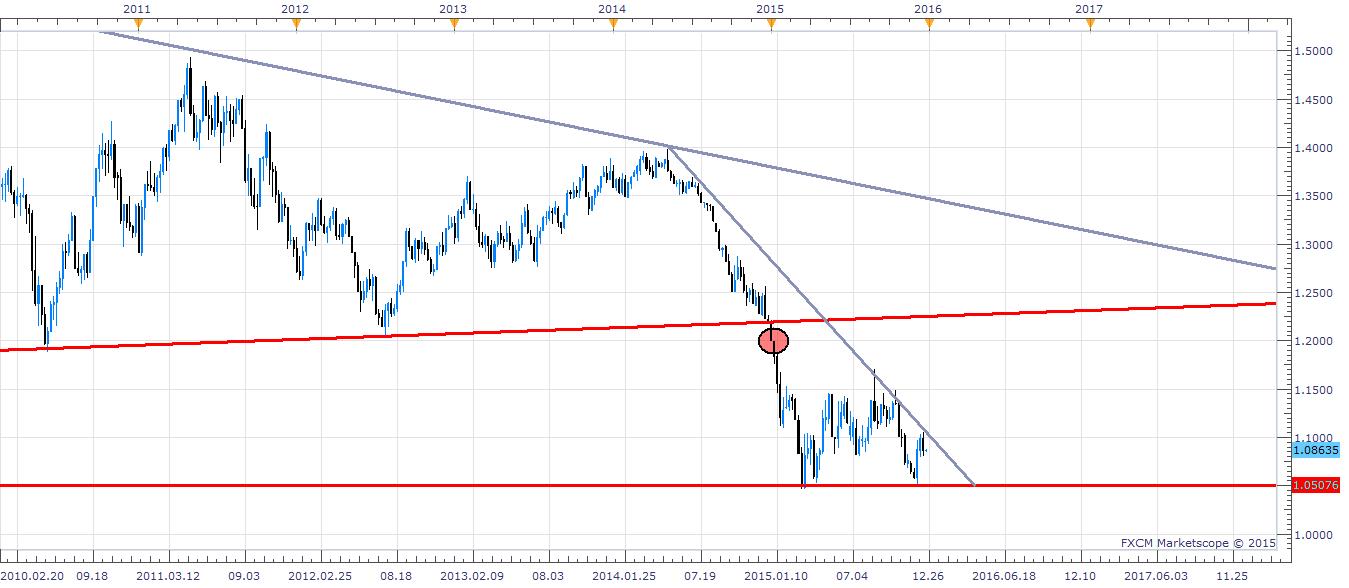
EUR/USD WEEKLY
I made my prediction when the rate was trading at 1.1900 (red circle) and was looking for a move to 1.0750. Although the rate moved down a lot faster than I had anticipated, a yearly low was set at 1.0457 and the rate has spent the rest of the year consolidating the losses as it gears up for the next possible down move towards the parity and my long term target at 0.8000.
I also mentioned the Fed was going to raise interest rates within the first three months of 2015, however, the massive price fall on crude oil was responsible for very low inflation all over the world, therefore, creating circumstances where a rate hike would be very dangerous.
The growing differences between the two central banks still supports my downside view, as the ECB expanded their ABS purchase programm (QE) and Fed just hiked the rates for the first time in 9 years.
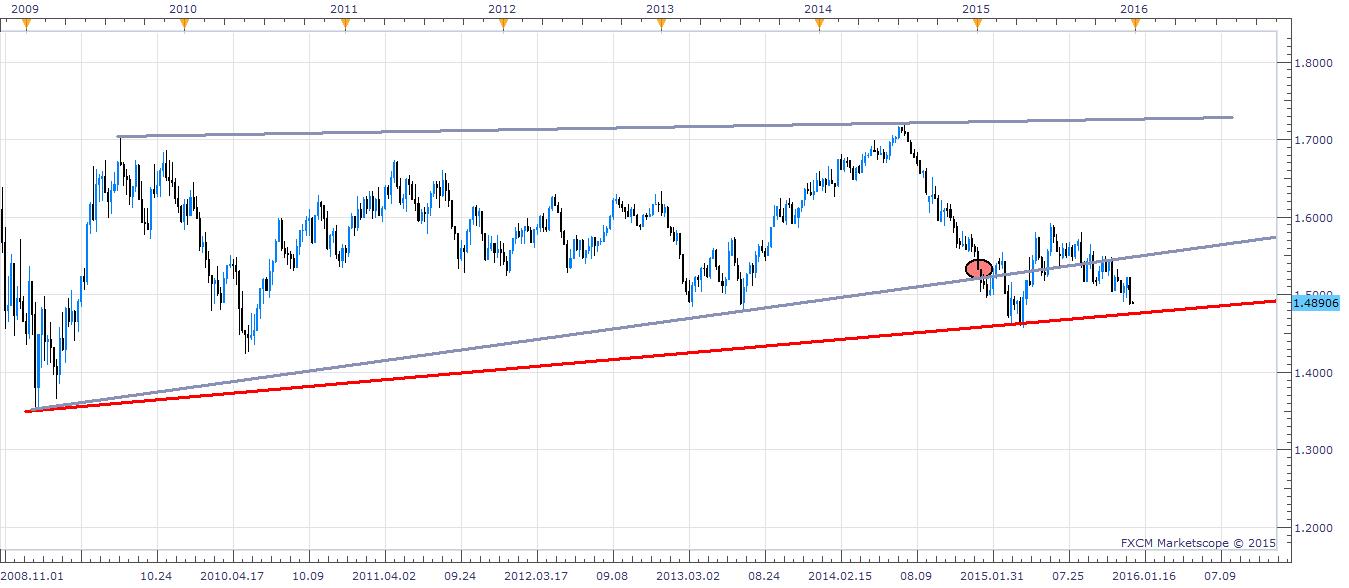
GBP/USD WEEKLY Unlike the EUR/USD, my prediction for the cable came nowhere near my initial targets, as after a bounce higher the first half of the year the rate is virtually unchanged now - a year later - trading at 1.5000 level. This is still a difficult pair as it can still go either way. The Bank of England is still the second next most hawkish bank after Fed and it is possible we may also see the first hike form them in 2016. A lot will depend on the pace of the Fed future rate hikes too.
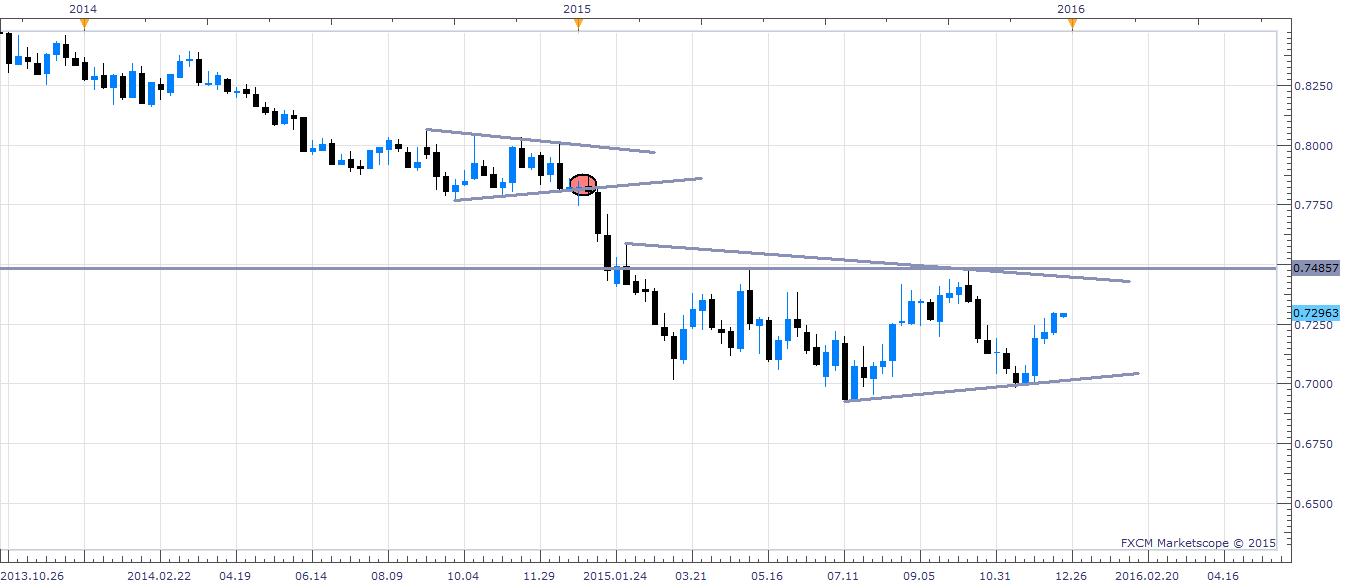
EUR/GBP WEEKLY The prediction was made when the rate was trading around 0.7800 level (red circle), and it turned out to be one of my most successful trades this year as not only it took off to my targets very fast but I even managed to ride my profits way lower to around 0.7200 level. Currently the rate is trading in kind of a similar situation (a symmetrical triangle), however, by compering the two patterns, the one we are trading within at the moment is about 3 times more massive than the one we had been stuck in a year ago, therefore, maybe the next breakout move is going to provide us with another great trade.
AUD/USD WEEKLY No real prediction came from from me for the aussie, however, it broke the major 0.8000 level almost immediatelly after I'd made the video and is now trading 1000 pips lower around 0.7000 level within a symmetrical triangle formation. My bias is still with the preceding trend lower, and a breakout from the pattern may take us to 1000 pips lower once again to 0.6000.
EUR/AUD WEEKLY
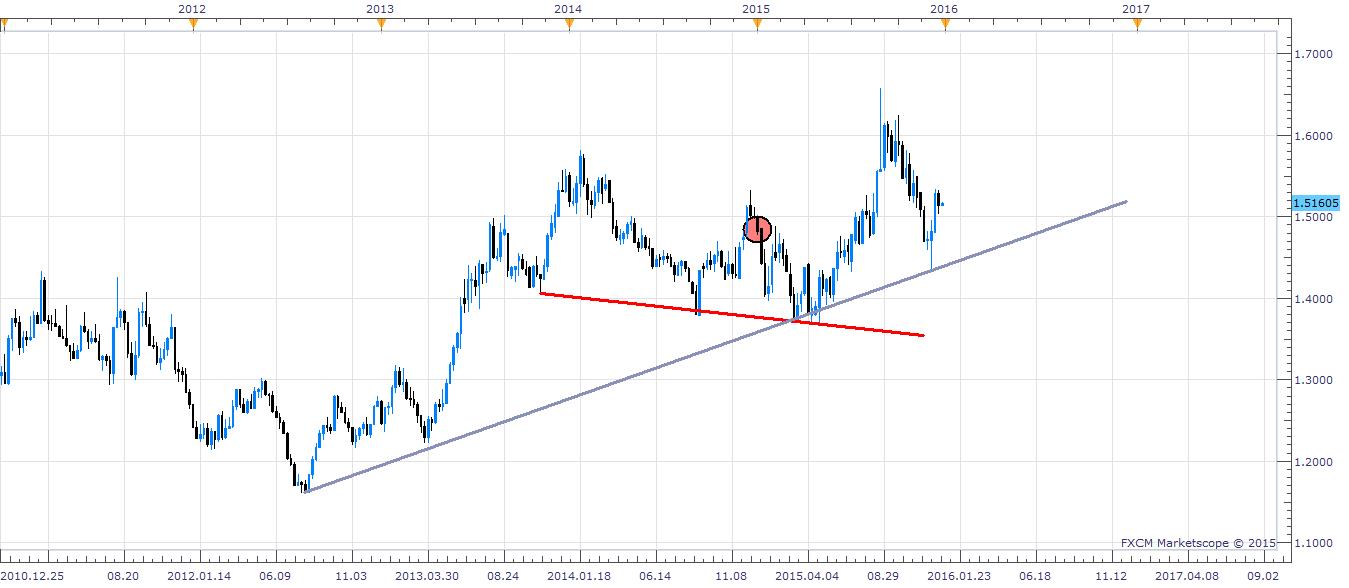
This is one pair where my prediction went completely wrong. Although the rate quickly hit my first target at the pattern's neckline at 1.4000 it didn't manage to break through and rebounded up leaving the rate virtualy unchanged a year later, trading just above the 1.5000 level.
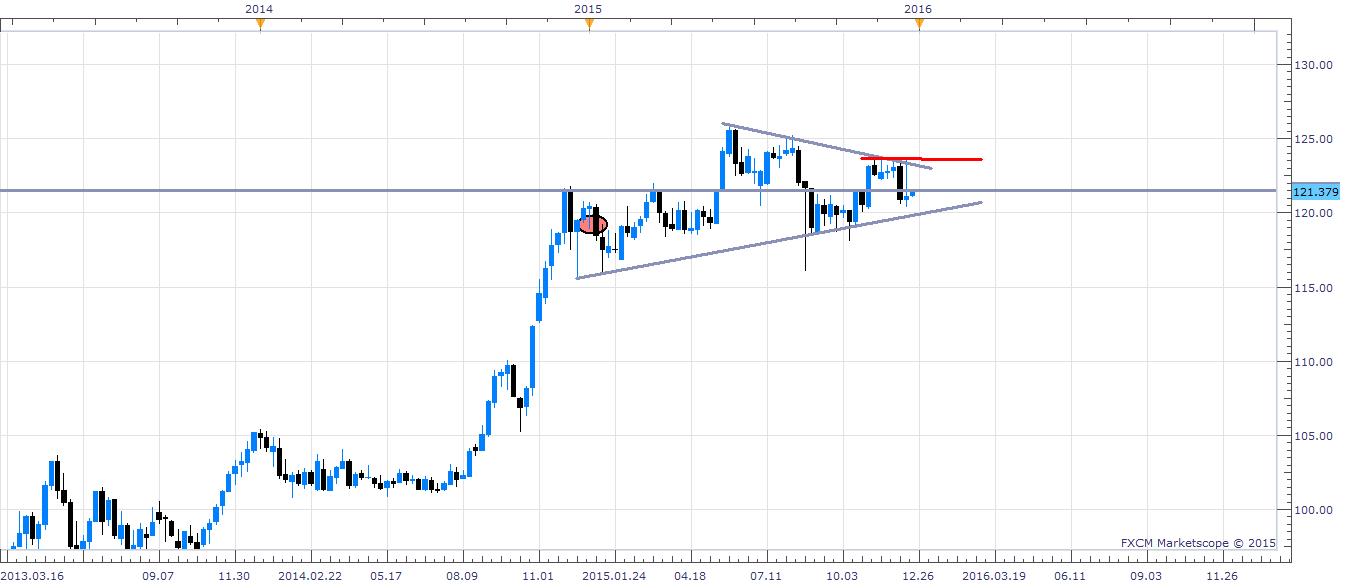
USD/JPY WEEKLY
Although the rate has managaed to drift itself a little higher, I was right about the start of a huge consolidation pattern. In fact the rate is performing very consistnatly with it's historical movements as after the massive move higher in 2014 the rate has spent all of the 2015 consolidating in this very familiar looking symmetrical triangle pattern. The plan is still as before - trying to catch the breakout as soon as possible as it will move a lot and it will move fast.
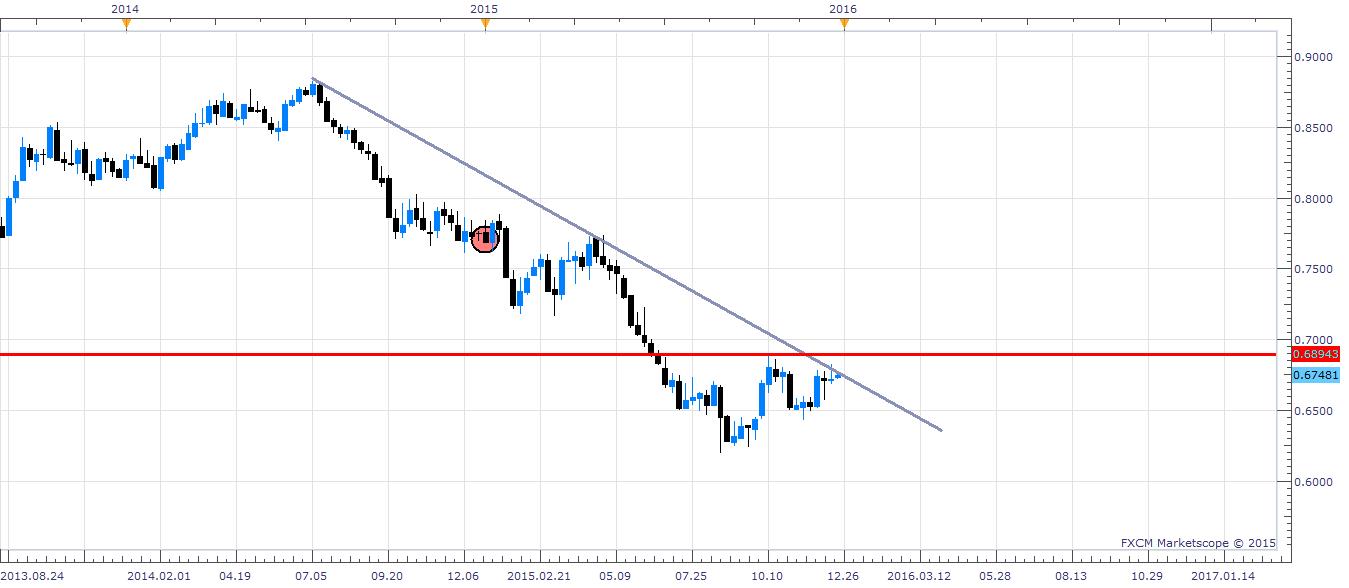 NZD/USD WEEKLY
As predicted - after breaking the consolidation range at 0.7700 (red circle) the rate continued trading with the preceding trend lower and stopped only around 0.6200 level. Since then the rate has been retracing higher and is now trading at the 2-year falling trendline resistance, therefore, my bias is still lower as long as we are trading below 0.7000 level.
