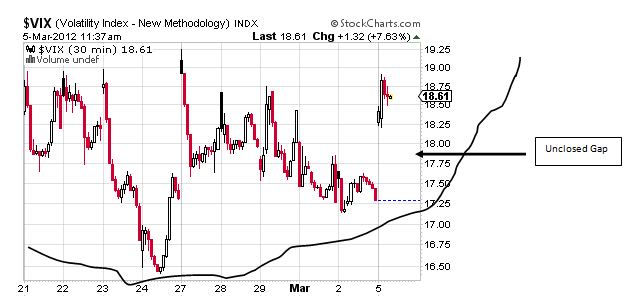
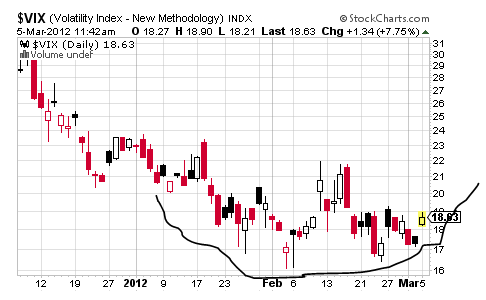
In looking at the intraday charts of the VIX, the combined picture supports a move down to about 17.65 before trading up toward 28.

Specifically, today’s move up in the VIX is on an unclosed gap and that gap will close before the VIX has any shot of moving higher and this suggests that the S&P will trade narrowly sideways between probably about 1357 and 1377 for a few days before it likely trades sharply down in looking at a possible Rounding Bottom in its daily chart.

This Rounding Bottom is comprised of a Complex Head and Shoulders pattern and/or Double Bottom, but at a minimum, it confirms at 22 for a target of 28 with further confirmation coming at 24 for a target of 32.
Should this pattern turn out to be good, it speaks to a spike up in volatility and a spike down in the S&P, but prior to such potential inverse directional moves between the VIX and the SPX, there is likely to be a bit of narrow sideways trade ahead and this may suggests that Friday’s payrolls report will miss the mark somehow.
And those are just a few of the possibilities that come from taking a look at the VIX.

Specifically, today’s move up in the VIX is on an unclosed gap and that gap will close before the VIX has any shot of moving higher and this suggests that the S&P will trade narrowly sideways between probably about 1357 and 1377 for a few days before it likely trades sharply down in looking at a possible Rounding Bottom in its daily chart.

This Rounding Bottom is comprised of a Complex Head and Shoulders pattern and/or Double Bottom, but at a minimum, it confirms at 22 for a target of 28 with further confirmation coming at 24 for a target of 32.
Should this pattern turn out to be good, it speaks to a spike up in volatility and a spike down in the S&P, but prior to such potential inverse directional moves between the VIX and the SPX, there is likely to be a bit of narrow sideways trade ahead and this may suggests that Friday’s payrolls report will miss the mark somehow.
And those are just a few of the possibilities that come from taking a look at the VIX.
3rd party Ad. Not an offer or recommendation by Investing.com. See disclosure here or remove ads.
Which stock should you buy in your very next trade?
With valuations skyrocketing in 2024, many investors are uneasy putting more money into stocks. Unsure where to invest next? Get access to our proven portfolios and discover high-potential opportunities.
In 2024 alone, ProPicks AI identified 2 stocks that surged over 150%, 4 additional stocks that leaped over 30%, and 3 more that climbed over 25%. That's an impressive track record.
With portfolios tailored for Dow stocks, S&P stocks, Tech stocks, and Mid Cap stocks, you can explore various wealth-building strategies.
