A year end series taking a longer perspective in many market indexes, macro related commodities, currency and bonds. Over the next three weeks these reviews are intended to help create a high level road map for the the next twelve months and beyond. We continue with the Shanghai Composite, SSEC.
The Chinese market can mean different things to different traders. To a US trader it usually means the iShares FTSE China 25 Index Fund, (FXI). This is the most liquid way to play China outside of China, but it focuses on larger and mainly state owned assets and banks. It is not a good representation of the entire Chinese market place. To get that, you need to look at the Shanghai Composite, and to trade it you need to be in China.
For purposes of how the Chinese market is doing and how it might influence our markets just observing the Shanghai Composite will be enough. Starting with the monthly below there are 4 major areas that stand out. The first is the steep run up from mid 2005 to late 2007 where the world gained the impression that the US and Chinese markets were intertwined. The leg down along side the U.S. market correction during the financial crisis then retraced nearly 88.6% of that before a bounce higher also along side the US Markets.market correction during the financial crisis then retraced nearly 88.6% of that before a bounce higher also along side the US Markets. At that point the two markets decoupled though and the Shanghai Composite has been moving lower in a channel since July 2009, while US markets are at new all-time highs.
It is at a critical juncture as 2013 ends. The Composite is testing the top of the channel with a Relative Strength Index (RSI) that is stalling again at the mid line. It has not spent any material time in even modestly bullish territory since March 2008, going on 6 years. The latest trend since June though is higher and the MACD is starting to roll higher. If it can break this channel then there is resistance at the zone near 50 and 100 month Simple Moving Average (SMA) up to 2615 and then it would start to look very bullish. So is there a shorter term catalyst to get over that channel? Zoom in to the weekly chart below. It shows a choppy channel between 2500 to the upside and about 2000 to the downside since late 2011. It looks like a potential bottoming pattern. But the far right side also shows a bearish Deep Crab harmonic pattern building and on the verge of a long entry signal.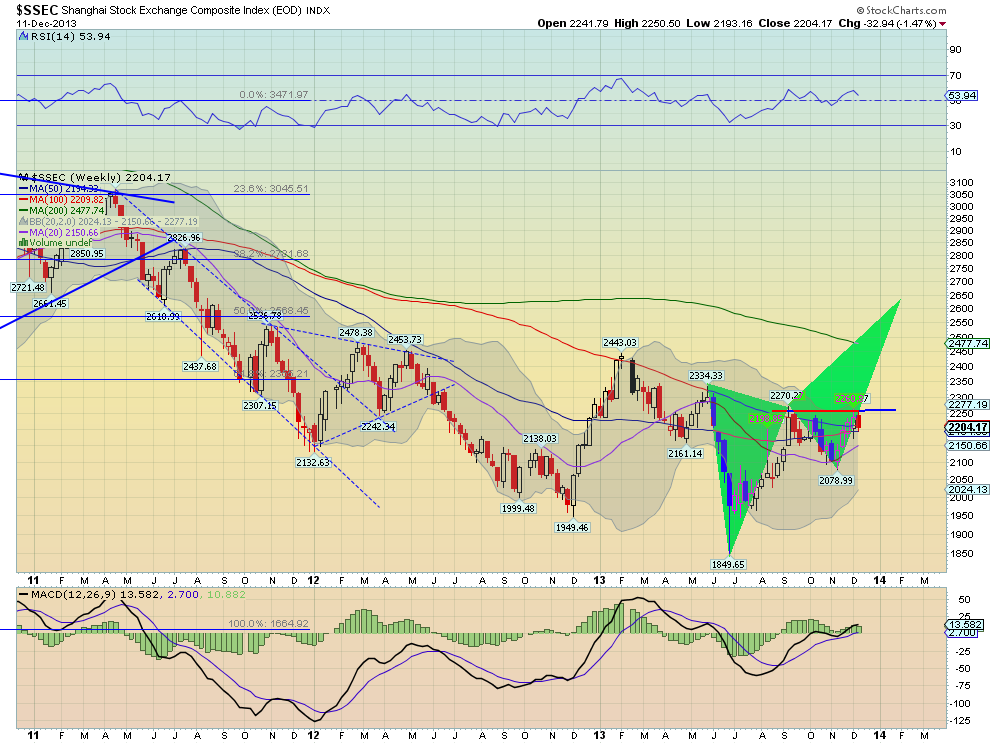
The resistance at 2260 if broken would not only trigger a continuation toward the Measured Move higher at 2500 but confirm the Deep Crab and its potential reversal zone at 2630. So not only a catalyst over the falling channel on the monthly chart but also over the SMA zone.
Taking a finer look in on the daily chart shows there has been a lot of action over the last year. A head and Shoulders Top that achieved its price objective lower and then some. This was followed by bearish Bat harmonic that also retraced 50% of its pattern. And now a bearish Shark that has pulled back almost exactly 38.2% from its peak. A bounce here would make a higher low and allow for another leg higher. It would then take a move over 2260 to get the ball rolling. So a move over 2260 sets up the daily chart for a move higher that would trigger an upward bias in the weekly chart with a target of 2500 to 2600 that in turn would break the monthly chart out of its downward channel and over major resistance areas turning the long term view bullish. 2260 is the key the the future of the Shanghai Composite.
Disclosure: The information in this blog post represents my own opinions and does not contain a recommendation for any particular security or investment. I or my affiliates may hold positions or other interests in securities mentioned in the Blog, please see my Disclaimer page for my full disclaimer.
Original post