Thursday was a strong down-trend day with all markets falling 1.5 to 2%. That hasn't happened for a long time so sentiment is moving to extremes. Lots of questions and rhetoric about this being 'THE top' and 'how far will the indexes fall.' The Fear-Greed Index has shifted to extreme fear. Blood in the streets.
All told, though, the major indices are less than 3% from their all-time highs, except for the Russell 2000, which is off about 6.5%. So is the IWM about to lead a major sell off or is it just bearing the brunt of a mild move across the board? What should we make of this crack in the index's support structure?

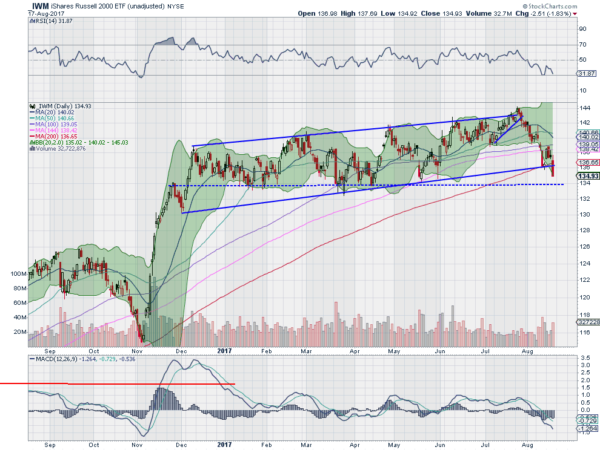
The chart above shows IWM's price action. It had a sharp run higher after the election and then settled into a rising channel at the end of November. Since then, it remained in that channel, slowly grinding higher — until Thursday. After a bounce off the bottom at the start of the week, the price stalled when it hit the 100-day SMA and then reversed Thursday back below the bottom of the channel, ending at the low of the day. This took it below the 200-day SMA for the first time since June 2016.
It only stayed below 2 days on that trip. Will this be the same? Momentum suggests it could continue lower. The RSI is bearish and the MACD negative and falling. This is a big deal. A key area left to watch is the longer-term horizontal support at 134. A drop below that would leave much less price history that could act to stop a drop until 124. Too early to call a major trend change, but certainly time to pay much closer attention, and polish off your risk management plan.
