The Hedge Fund Mirage
, a book by Simon Lack, has attracted considerable attention in the press over the past few months. It was reviewed favorably in several well-respected financial newspapers and has been cited as an authority in several recent articles on hedge fund performance. Lack’s headline-grabbing conclusion is that hedge fund managers were paid 84% of every dollar the industry made during 1998-2010.
The actual number is somewhere between 35% and 40%. Lack’s analysis is somewhat convoluted and confusing, but it appears that his estimate is badly overstated for two simple reasons: first, he relies on a distorted estimate of “hedge fund industry” returns that skews his analysis and, second, he deducts the risk-free rate from “net investor profits.”
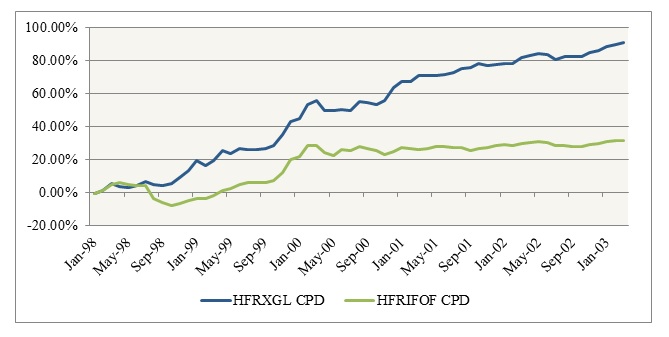
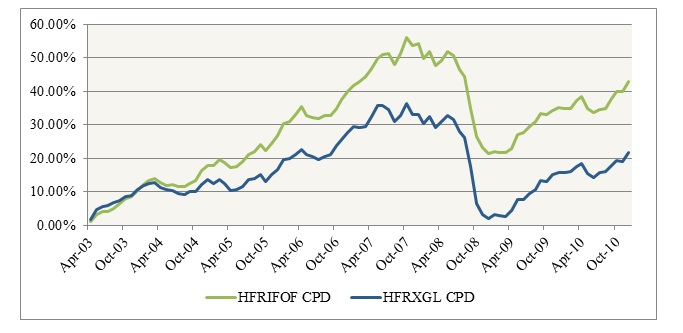
Inexplicably, Lack uses a hedge fund index – the HFRX Global Investable Hedge Fund Index (HFRXGL) – that simply didn’t exist until March 2003, or almost halfway though the period studied. The pro forma numbers preceding inception are replete with “backfill” bias, and hence not reflective of actual industry returns. From January 1998 through March 2003, returns are overstated by over 6% per annum, or roughly double actual industry returns. In the chart below, the performance of the HFRXGL during the “pro forma” period to that of the more reliable HFRI Fund of Funds index. (See Jan 2012 blog post The Least-Biased Way to Estimate “Hedge Fund Industry” Returns for a more detailed explanation.)  By contrast, from 2003 to 2010, the index had a design flaw that created a statistical problem called “adverse selection.” Better managers simply refused to join this particular index given requirements for managed accounts, transparency and liquidity. Consequently, during the “live” period, the HFRXGL underperformed more reliable measures of hedge fund industry returns by almost 4% per annum. (Lack argues that the HFRXGL numbers should have an additional “haircut” of around 3% per annum since, as he notes, some indices have an upward statistical bias. This assertion should be dismissed and is further evidence of a failure to understand the HFRXGL.)
Accidentally, it seems, the compound returns for the HFRXGL for 1998-2010 are similar to actual industry returns – around 7% per annum. The issue arises when that Lack insists on the use of “dollar-weighted” returns or, more precisely, weights each year’s percentage returns by average assets under management. Since the HFRXGL returns are badly understated during the high AUM period, the latter years of “poor” performance are given far too much weight. Correcting for this, the results are around 35-40% to hedge fund managers, not the 84% he cites.
The second issue is that Lack deducts Treasury bill yields from net investor returns. In rough terms, the average Treasury bill yield over 1998-2010 was approximately 3.4%, or roughly half industry returns of 7% per annum. This statistic shocks most investors; it’s a good argument for industry-wide hurdle rates and one of the most often overlooked issues in the industry. Unfortunately, today there are many asset classes that failed to even match the returns of short-dated Treasurys over the same period.
The problem is with the distorted HFRXGL numbers – too high early on, too low later. During 1998-2002, the pro forma returns were over 13% per annum, or 800 bps over the average risk-free rate of 5.2%. For 2003-2010, by contrast, the index outperformed the risk-free rate by only 100 bps per annum (3.4% to 2.4%). Using dollar weighted returns, the latter years are overemphasized and result in the risk free rate accounting for over 80% of net investor dollar profits. The end result is that the numbers provide a compelling case for how industry returns have declined relative to the risk free rate in recent years as AUMs have grown.
Ironically, using this metric and a more accurate gauge of industry returns, the latter years actually look better. (I question whether it is in fact a useful metric, but that’s for another time.) During 1998-2002, when short-term rates were higher, the industry returned approximately 200 bps over the risk free rate; over 2003-2010, the industry returned 350 bps per annum over the risk-free rate. In any case, overall the risk-free rate was equivalent to approximately 50% of net investor dollar profits, not the 80% he calculates.
To conclude, serious debate requires rigorous analysis. As someone who has spent the past six years spearheading practical ways to enable investors to get “hedge fund returns” with lower fees, more transparency, better liquidity and other features, I find myself in agreement with Lack’s general conclusions: indeed, there has been a big drop off in industry performance since 2007 and many managers certainly are overpaid.
However, I’m disappointed by the lack of careful analysis. AIMA’s thirty page paper in response to Lack’s book missed the critical issue – that the HFRXGL is simply the wrong starting point. The most compelling argument in Lack’s book is that investors would benefit from a hurdle rate on incentive fees – whether based on a risk free rate or market beta — but this is lost in his confusing and misguided analysis.
Andrew D. Beer is the Chief Executive Officer of Beachhead Capital Management, LLC, a hedge fund advisory firm based in New York, NY and Lexington, MA. Previously, Mr. Beer served as the Senior Advisor and seed investor of Belenos Capital Management and co-founded Apex Capital Management, a leading Asia-focused investment firm that manages several market neutral and directional hedge funds from New York and Hong Kong. Prior to this, Mr. Beer co-founded Pinnacle Asset Management, a commodity fund of hedge fund firm that manages over $2 billion. Mr. Beer received his M.B.A. as a Baker Scholar from Harvard Business School and his A.B., magna cum laude, from Harvard College.
