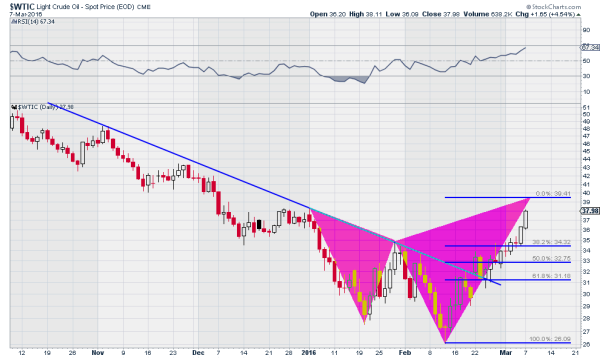
Crude oil started a move lower in July 2014, made an interim low to start 2015, and then bounced into the spring. The black liquid ran lower again starting July 2015 to a low in September before yet another bounce. This too was sold off starting in October, reaching a bottom just a few weeks ago.
There were two interesting factors in the crude oil chart to note during the last 6 months. First is the smooth downtrending resistance that kept preventing the price from making a higher high as it fell. Each time crude met this falling line it sold off again. With hindsight we can see that the falling price action morphed into a sideways consolidation mid-way through January, and that finally pushed sideways through the falling resistance in late February.

The second interesting piece of information is the price pattern since the beginning of 2016. The price action has traced out a harmonic shark pattern. This is a bearish pattern, as it looks for failure at the top of the second triangle and a retracement of either 38.2% or 61.8% of the pattern. This last leg higher, a harmonic bounce, still has more room to the upside, and as I write Tuesday morning, the price of crude looks coiled for another move higher in the short-term.
A harmonic pattern showing up does not mean that the price WILL reverse, but it does give an indication of where traders might be watching to take profits. Patterns fail and extend all the time. Keep your eyes and mind open and watch what happens.
Disclaimer: The information in this blog post represents my own opinions and does not contain a recommendation for any particular security or investment. I or my affiliates may hold positions or other interests in securities mentioned in the blog, please see my Disclaimer page for my full disclaimer.
