At the Tops of Multiple Long-Term Formations

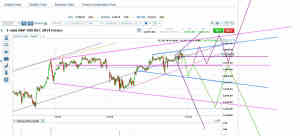
ES is Forming a Megaphone (Blue) across VWAP of a Larger Megaphone (Pink)
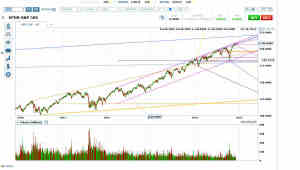
ES has formed a megaphone (bright blue in chart above) across VWAP of a larger megaphone (pink) at the top of a 3-year price channel, 1-year megaphone, and 6-month megaphone within the 1-year megaphone (see chart below).

SPDR S&P 500 (ARCA:SPY) is at the Top of a 3-year Price Channel, 1-Year Megaphone, and 6-Month Megaphone
ES and SPY need a retrace to ES 1955/SPY 196 before they are legal to break out upwards from the 6-month megaphone.
The blue megaphone in the top chart would usually put in another wave to the bottom before retracing to VWAP to decide on breakout direction.
A downward breakout from the blue megaphone would suggest a downward breakout from the pink megaphone.
An upward breakout from the blue megaphone would suggest a trip to the top of the pink megaphone for a small breakout and topping formation.
Lots of Major Decisions to be Made on the Dollar, Euro, Junk Bonds and the 10-Year
The dollar is at the top of a 47-year falling wedge and the euro is at the neckline of a huge topping formation that began in 2008.
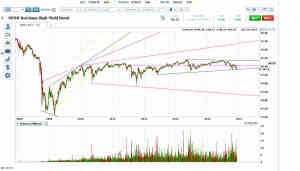
SPDR Barclays High Yield Bond (ARCA:JNK) is at the bottom of a triangle that goes back to 2012 within a megaphone that goes back to 2010, with a downward breakout suggesting a big drop to the megaphone bottom or beyond. (Think junk bond crisis, maybe due to falling oil prices.)

JNK is Legal for a Downward Breakout from Navy Blue Triangle – Also Legal for Downward Breakout from Red Megaphone
The 10-Year is forming a good-sized megaphone across VWAP of a long-term megaphone for a likely surge.
There are long-term divergences and topping signals starting to show up on indicators and the market is at critical Elliott Wave numbers.
But the market survived the NFP report without strong selling and we’re getting into the heart of holiday bullish seasonality. Draghi is still bluffing his way through ECB announcements that never include actual stimulus.
A Perfect Set-Up to Drift
All kinds of trading instruments could start major moves any time now. But this is the kind of moment when the market likes to stall for time.
If the big decisions on the dollar and euro are really going to get made here, the dollar would usually fool around retesting the top of the 47-year falling wedge before it got going on any serious breakout. And the euro would usually move sideways just above, just below, or across the neckline of its 6-year topping pattern.
JNK would often form a smaller continuation triangle along the bottom of its navy blue triangle.
I expect the blue megaphone to break out upwards in the purple scenario on the top chart so that the price can reach the top of the pink megaphone and break out to move sideways up there and through the top of the three-year price channel.
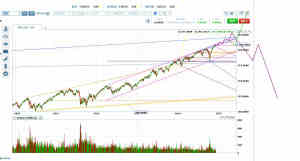
That would set up a retrace to at least ES 1955/SPY 196 after the holidays. If that retrace reverses at ES 1955/SPY 196, it would set up an upwards breakout from the 3-year price channel into a series of melt-up price channels.
If the market collapses through ES 1955/SPY 196, it sets up a collapse to the level of the October 15 low, and that would put a potential head and shoulders on the long-term charts.

Long-Term Scenarios
Right now, I can’t tell if the market will get through the ES 1955 level or not. We should know a lot more before it starts that retrace.
