Do you want to get your fix before the precious metals slide again? Recent moves in gold and the USD have made miners an attractive short-term bet.
The liqueur known as Danziger Goldwasser is well known for the fact that it contains small flakes of 23 karat gold in it. You can drink it neat or mix it into a concoction, but cocktails are meant to be drunk slowly. The GDX miner’s ETF shot best be downed quickly.
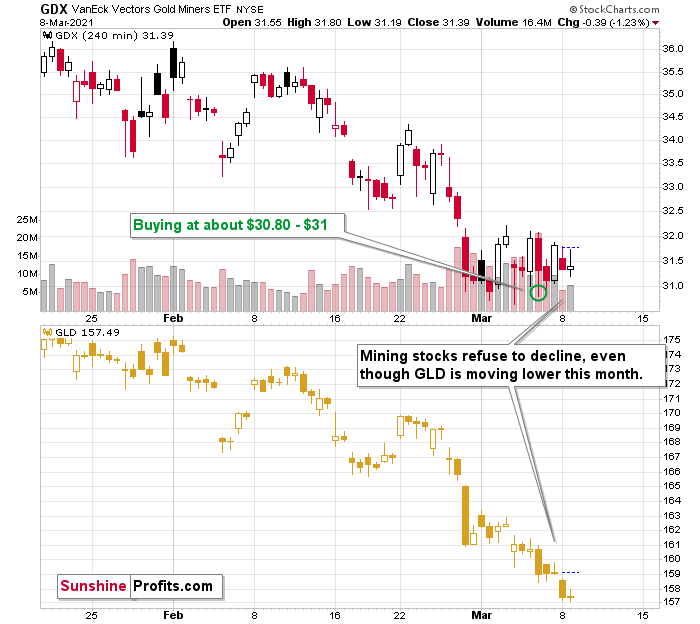
Gold moved to new yearly lows yesterday (Mar. 8) and mining stocks didn’t. That’s a very good indication that a short-term bottom in the precious metals sector is likely in.
One of the key indicators that was constantly pointing to lower precious metals values over the past several months was mining stocks’ weak performance relative to gold. This trend has now – at least temporarily – reversed, so it’s very important that one pays attention to it.
Figure 1 – GDX and GLD ETF Comparison
The above 4-hour chart (each candlestick represents 4 hours of trading) makes it crystal-clear that the late-February bottom was the moment after which miners stopped declining and started to trade sideways. Gold (here: the GLD ETF, which I’m using to have an apples-to-apples comparison – both ETFs trade on the same exchange) continued to decline in March. Well, to be precise, miners did form new yearly lows in March, and we went long almost right at one of those intraday lows, but the moves were not significant enough to really change anything.
So, since miners no longer want to decline, there are only two other things left for them to do: either nothing or rally.
They’ve been doing nothing for the past several days, due to the lack of bullish leadership in gold. And it seems that they are going to get this bullish ignition any day, or hour now.

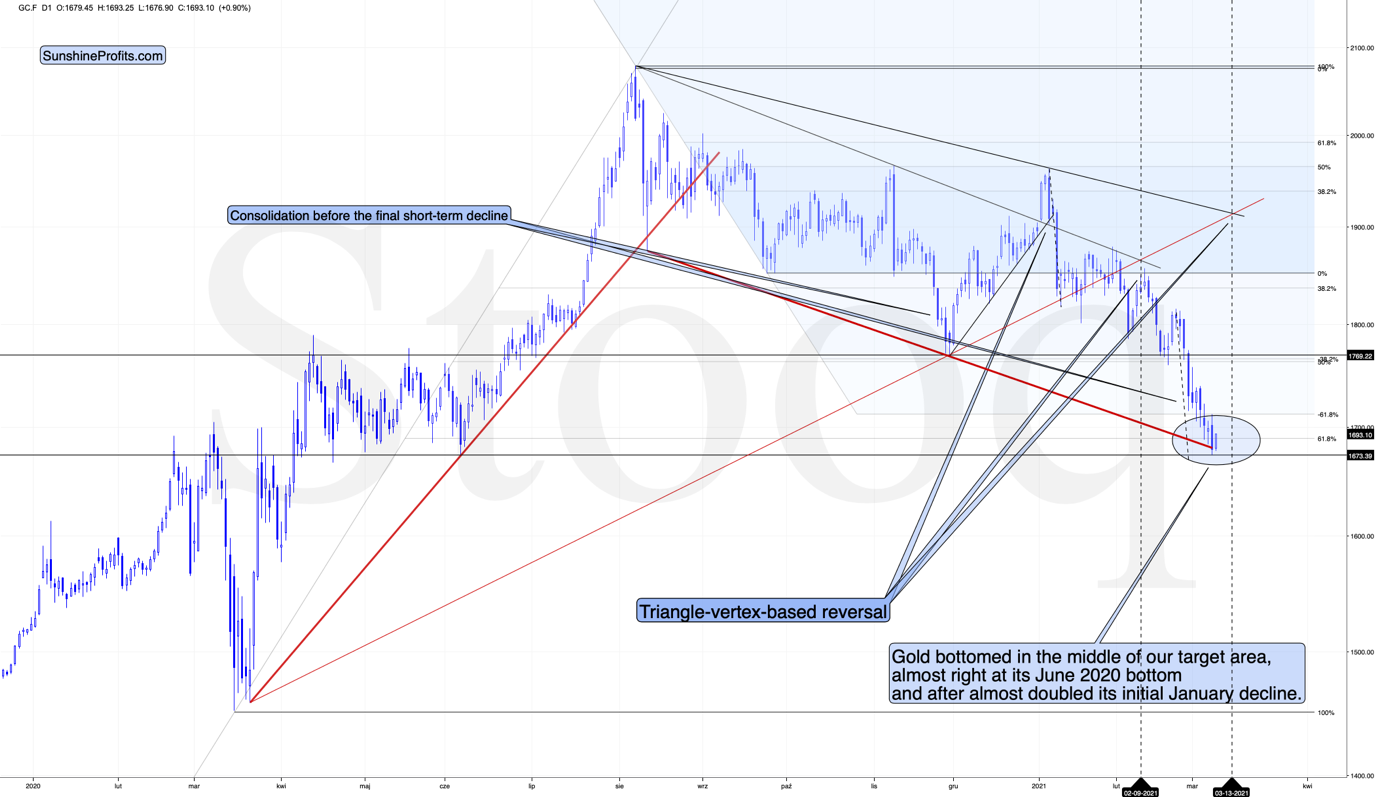
Figure 2 - COMEX Gold Futures
Gold is moving back up in today’s pre-market trading and since miners were able to shrug off yesterday’s decline, then today’s comeback would likely trigger their upswing.
Please keep in mind that the upswing mind be relatively short-lived – perhaps lasting only one week or so. There’s a triangle-vertex-based reversal point on Monday, so it wouldn’t be surprising to see an interim top at that time, especially considering that:
- The triangle-vertex-based turning points have been working particularly well in the recent past – they marked the January and February tops.
- The corrective upswings during this medium-term decline (especially in mining stocks) often took about a week to complete – at least the easy part of the upswing took a week.
The USD Index has been rallying relentlessly – just like in 2018 – in the last couple of days, but a quick pullback would not be surprising. In fact, the USD Index is already lower in today’s pre-market trading.

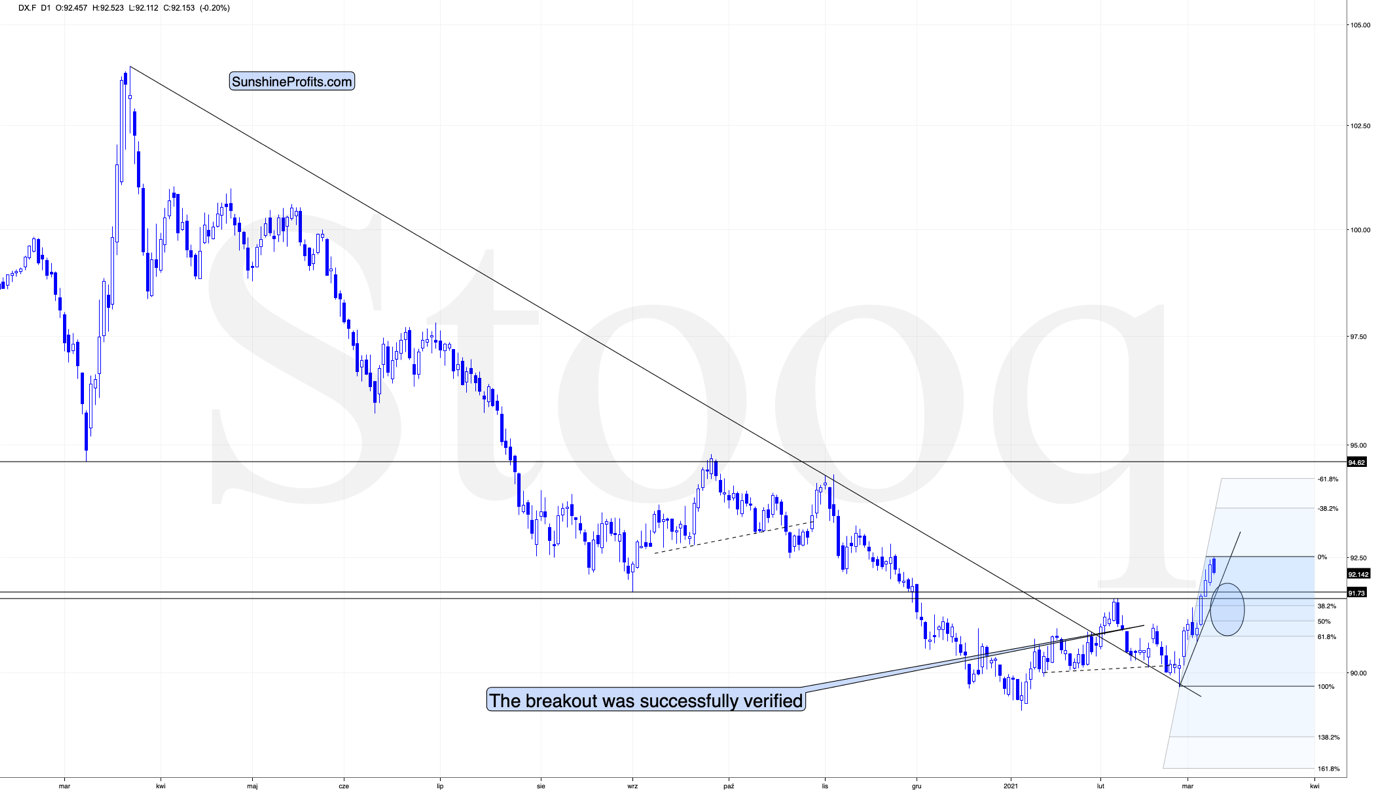
Figure 3 - USD Index
Yesterday, the USD Index closed above its lowest daily closing price of August 2020 (92.13), but at the moment of writing these words, it’s already after a move back below it. If the USDX closes the day below it, we’ll have an invalidation of a breakout with bearish implications for the very short term.
How low could the USD Index move during this pullback? Not particularly low, as the similarity to 2018 implies a rather unbroken rally. The February 2021 high of 91.6 seems to be a quite likely target, but we might see the USDX move a bit lower as well – perhaps to one of the classic Fibonacci retracements based on the recent upswing – lowest of them (the 61.8% one) being at about 90.8.
Ultimately, it seems that the above corrections will result in the GDX ETF moving to about $34 or so.

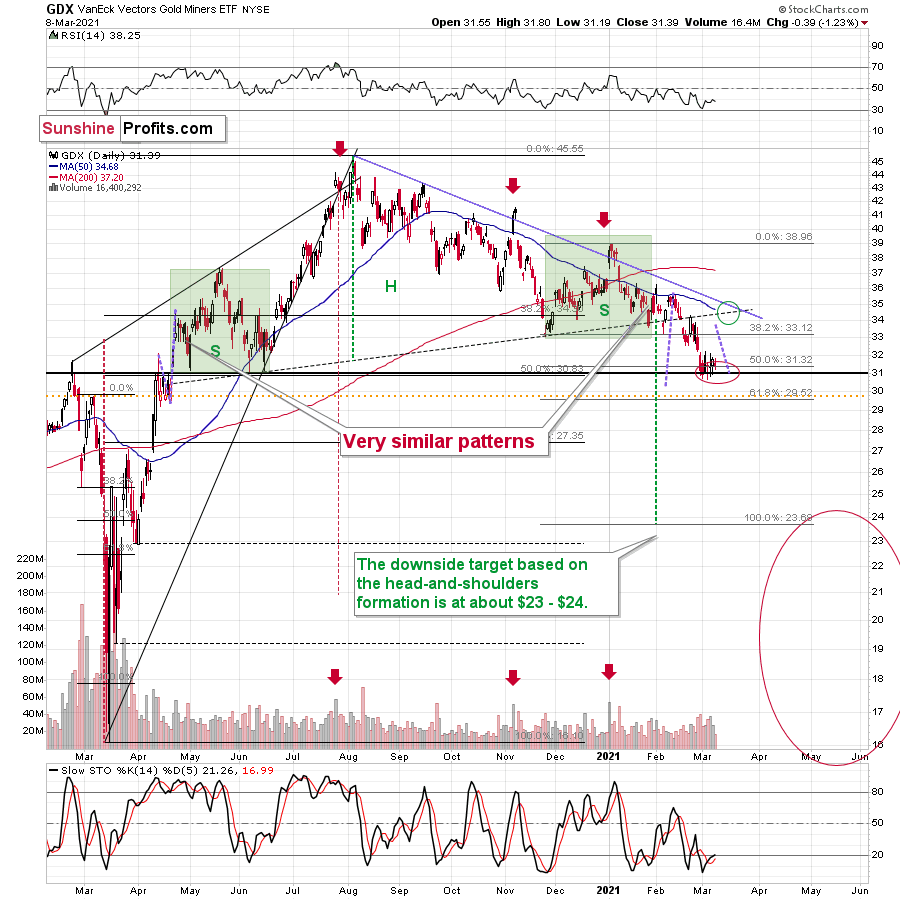
Figure 4 - GDX
The resistance levels in the $34 - $35 area are provided by:
- The late-February 2020 high
- The rising neck level of the previously completed head and shoulders pattern
- The analogy to how big miners’ correction was in April (assuming that the mirror similarity continues)
- The declining blue resistance line
- The 50-day moving average
Consequently, the GDX is likely to form a top in the above-described area.
After breaking below the head-and-shoulders pattern, gold miners would then be likely to verify this breakdown by moving back up to the neck level of the pattern. Then, we would likely see another powerful slide – perhaps to at least $24.
This is especially the case, since silver and mining stocks tend to decline particularly strongly if the stock market is declining as well. And while the exact timing of the market’s slide is not 100% clear, the day of reckoning for stocks is coming, and it might be very, very close.
As I explained previously, based on the similarities to the 1929 and 2008 declines, it could be the case that the precious metals sector declines for about three months after the general stock market tops. And it seems that we won’t have to wait long for the latter. In fact, the next big move lower in stocks might already be underway, as the mid-Feb. 2021 top could have been the final medium-term top.
In conclusion, the gold miners should continue to glisten as oversold conditions buoy them back to the $33-$35 range. Due to the GDX ETF’s recent strength, combined with gold rallying off of the lows on Mar. 5, the PMs could enjoy a profitable one-week (or so) party. However, with the celebration likely to be short-lived, it’s important to keep things in perspective. While this week’s performance may elicit superficial confidence, medium-term clouds have already formed. As a result, positioning for an extended rally offers more risk than reward.

