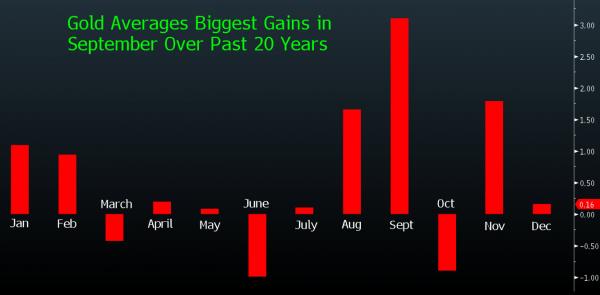
September is the hottest month of the year for gold prices, rising on average 3% over the past 20 years. As the yellow metal tests hovers off 2-month-lows, Bloomberg notes that “Indian jewelers and dealers will be stocking up in the coming weeks,” ahead of the festival period, which runs from late August to October (andis followed by the wedding season) when bullion is bought for part of the bridal trousseau or in jewelry form as gifts from relatives. As GoldCore’s Mark O’Byrne notes, “a lot of traders are aware of this trend towards seasonal strength… They tend to buy and that creates momentum.”

Chart: Bloomberg
Some color on the week’s Precious Metals Trading from Alasdair Macleod of GoldMoney,
The pattern of trading in precious metals changed for the better this week. After London’s bank holiday on Monday, for the first time in a long time the market opened in London’s pre-market with higher prices. This indicated Asian or Middle-Eastern physical demand was returning to the market. Predictably, prices drifted lower during London hours as paper trading took over, and all the gains were more or less lost by close of play on Comex in New York.
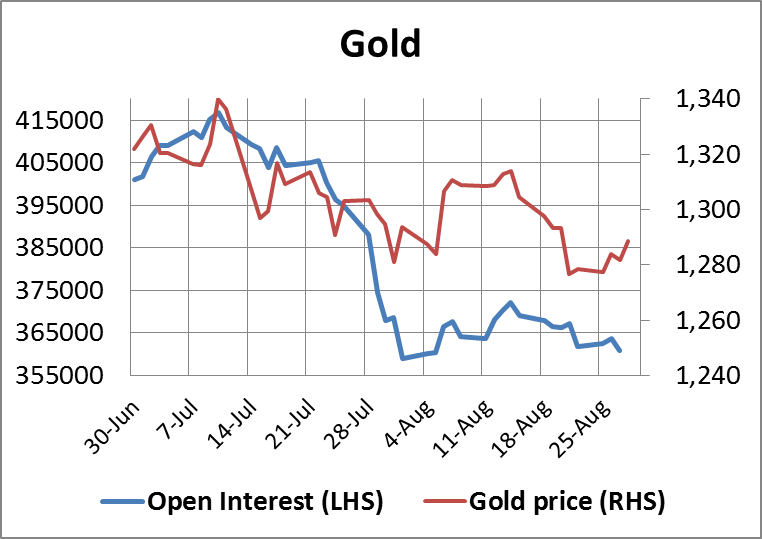
It was a similar story on Wednesday. Yesterday, (Thursday) started the same way, but this time the move gained more traction; but volumes remain pitifully low, in common with open interest. Today this pattern was not repeated with gold kicking off unchanged on overnight levels. However, gold is up $15 on the week and feels more firmly based.
Measured by deliveries on the Shanghai Gold Exchange, Chinese demand is increasing, with last week’s figure rising to 46 tonnes, having increased every week in August. So far this year over 1,200 tonnes have been delivered, and the extension of trading and therefore potential demand into the Free Trade Zone is due to kick off in September.
The chart of the gold price and open interest on Comex is shown below.

August is a notoriously poor trading month, with traders in the northern hemisphere on holiday, or at least not thinking about markets. September is wake-up time, and statistically the best month for gold. Will this be the pattern this year?
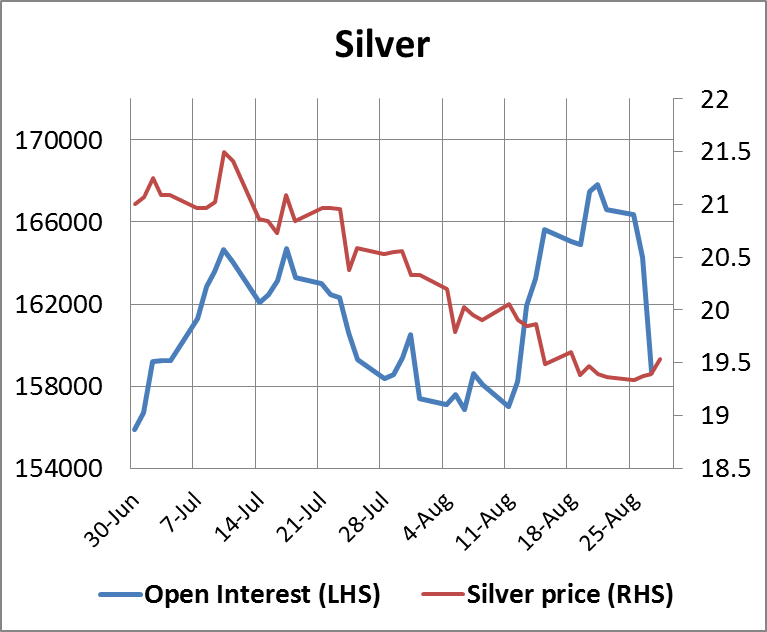
Trading in silver continues to be healthier, even if the price performance has been disappointing, with the gold/silver ratio rising to 66 from 63 earlier in the month. Open interest had its first significant fall on Wednesday, when the price rose marginally. This suggests that on balance there is some bear closing in futures. The action is shown in our next chart.

Could this be a harbinger of better times? Quite likely: being mostly an industrial metal, there is some evidence that commercial users are locking in low prices by holding futures positions. Bear in mind that two years ago, users probably estimated silver prices at $35+ in their business plans, so current prices for them are too good to miss.
Quick side-note: Palladium continues to power ahead, having made all-time highs consistently in recent months to challenge $900 this week.