Money has been moving out of Bonds but many suggest that it is not yet flowing into anything but cash. That could easily be an interim step for the summer. “Hey broker dude, just sell the bonds before they collapse and we will talk about what to do with it after I close the Hampton’s house. And can you get me into Stevie’s next party?”
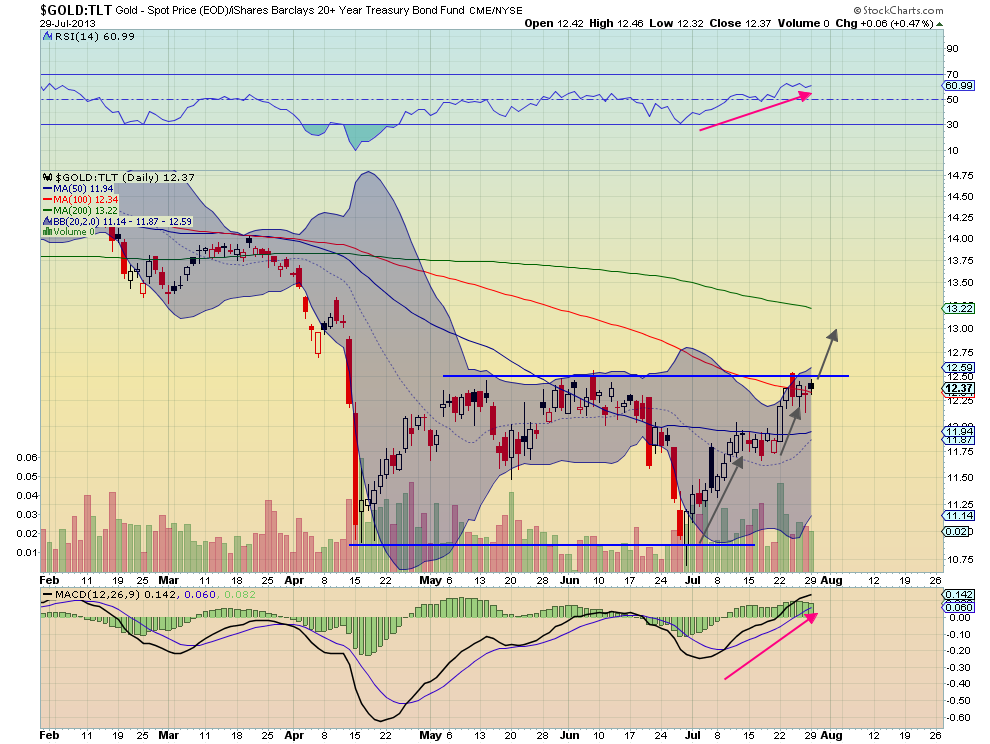
But the ratio chart of Gold (GLD) to my bond proxy, TLT, the 20 year US Treasury ETF, suggests flow may be occurring right now. Take a look. Over the last 3 months this ratio has been trading in a channel between a ratio of 10.80 and 12.50. Signs point to the strong possibility that it put in a double bottom in this channel and is ready to move higher. As it consolidates at the top of the channel, the Relative Strength Index (RSI) is rising to new highs and bullish while the Moving Average Convergence Divergence indicator (MACD) is also rising. 
Both support a push higher. The ratio itself is stepping higher and over the 100 day Simple Moving Average (SMA). The Measured Move (MM) on a break over the top of the channel takes it to the 13-13.25 area. At the low end of that is a 4% rise in Gold in terms of bonds or a 4% fall in bonds relative to Gold. That is worth trading.
Disclaimer: The information in this blog post represents my own opinions and does not contain a recommendation for any particular security or investment. I or my affiliates may hold positions or other interests in securities mentioned in the Blog, please see my Disclaimer page for my full disclaimer.
Original post
- English (UK)
- English (India)
- English (Canada)
- English (Australia)
- English (South Africa)
- English (Philippines)
- English (Nigeria)
- Deutsch
- Español (España)
- Español (México)
- Français
- Italiano
- Nederlands
- Português (Portugal)
- Polski
- Português (Brasil)
- Русский
- Türkçe
- العربية
- Ελληνικά
- Svenska
- Suomi
- עברית
- 日本語
- 한국어
- 简体中文
- 繁體中文
- Bahasa Indonesia
- Bahasa Melayu
- ไทย
- Tiếng Việt
- हिंदी
A Flow From Bonds To Gold
Published 07/30/2013, 08:03 AM
A Flow From Bonds To Gold
Latest comments
Loading next article…
Install Our App
Risk Disclosure: Trading in financial instruments and/or cryptocurrencies involves high risks including the risk of losing some, or all, of your investment amount, and may not be suitable for all investors. Prices of cryptocurrencies are extremely volatile and may be affected by external factors such as financial, regulatory or political events. Trading on margin increases the financial risks.
Before deciding to trade in financial instrument or cryptocurrencies you should be fully informed of the risks and costs associated with trading the financial markets, carefully consider your investment objectives, level of experience, and risk appetite, and seek professional advice where needed.
Fusion Media would like to remind you that the data contained in this website is not necessarily real-time nor accurate. The data and prices on the website are not necessarily provided by any market or exchange, but may be provided by market makers, and so prices may not be accurate and may differ from the actual price at any given market, meaning prices are indicative and not appropriate for trading purposes. Fusion Media and any provider of the data contained in this website will not accept liability for any loss or damage as a result of your trading, or your reliance on the information contained within this website.
It is prohibited to use, store, reproduce, display, modify, transmit or distribute the data contained in this website without the explicit prior written permission of Fusion Media and/or the data provider. All intellectual property rights are reserved by the providers and/or the exchange providing the data contained in this website.
Fusion Media may be compensated by the advertisers that appear on the website, based on your interaction with the advertisements or advertisers.
© 2007-2025 - Fusion Media Limited. All Rights Reserved.
