Crude oil has been on a slide for the last two months. In August and September I highlighted the breakdown that had been taking place, which eventually lead to 15+% drop in value for the Oil ETF (USO).
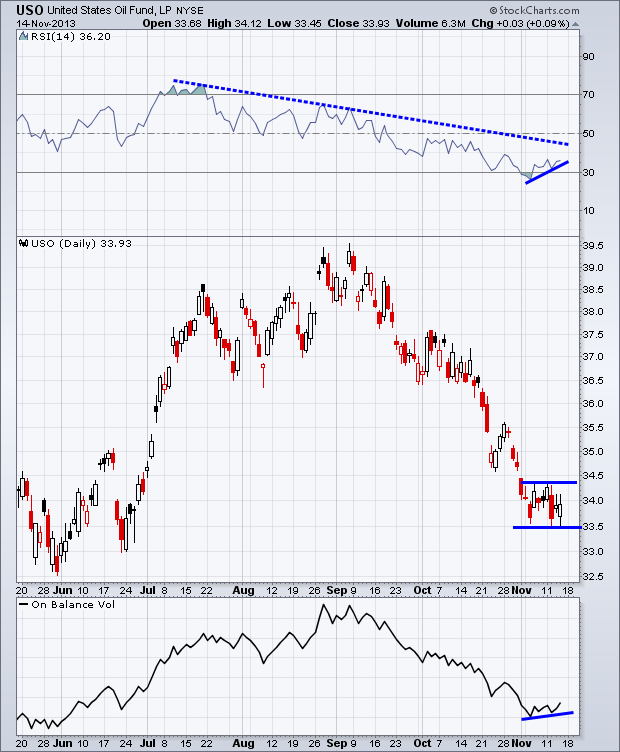
Today I want to take another look at the price action in USO and some of the bright spots that might be developing. First up we have the narrow trading range that USO has been in for the last couple of weeks. However, this consolidation could be viewed as bearish by some traders, making the assumption crude oil bears are just catching their breath before starting the next leg lower.
While USO has been flat with a slightly negative bias, we’ve seen a positive divergence created in the Relative Strength Index (RSI) indicator, which is in the top panel of the chart below. Momentum has been increasing while price has gone practically no where. I’d like to see the RSI indicator break above the down trend created off the July and August/September highs as a sign of strength to the upside. But the first sign we have is the positive divergence, it would be constructive if RSI worked its way back above 40, we’ll see what it does in the coming days/weeks.
On the bottom panel we have On Balance Volume. This indicator simply adds the volume on up days and subtracts volume on down days, attempting to give an idea of buying and selling pressure. This has also created a positive divergence as volume has been stronger on positive days than it has on days USO has been in the red.
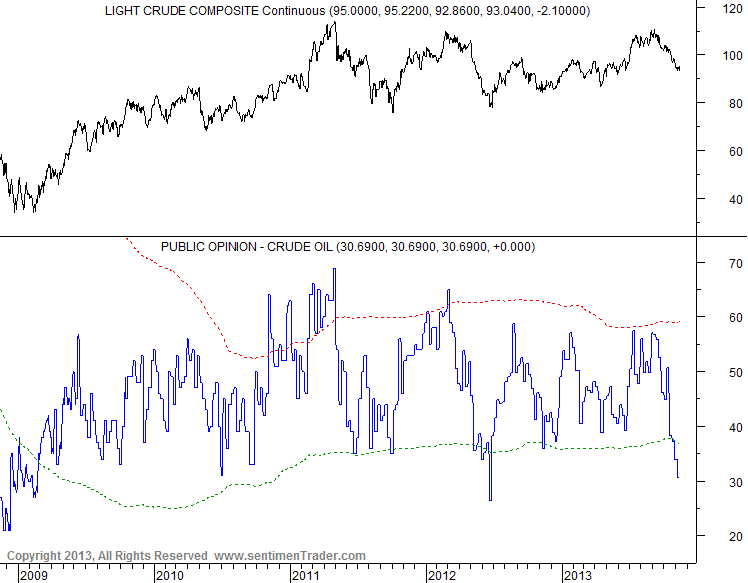
Looking at sentiment for crude oilwe have the Public Opinion data from SentimenTrader. As the chart below shows, there’s been a strong increase in bearishness for oil. Going back to 2009, the only previous time were sentiment was lower than it is today was in 2012. It appears no one wants to own oil right now, which is exactly what contrarians like to see.
One bearish argument that can be made for oil is based on seasonality, November isn’t a great month for oil. Since 1983, November has been the worst performing month seconded by October, which as we know, was also not a great month this year for crude.
Going forward I’ll be watching for a breakout of the current range in USO. If we see a break to the upside, confirming what we is taking place momentum and volume, then maybe we’ll start seeing signs of a change in trend. As always, I like to see confirmation before my bias shifts, and there’s no exception here. We’ll see what happens.
Disclaimer: Do not construe anything written in this post or this blog in its entirety as a recommendation, research, or an offer to buy or sell any securities. Everything in this post is meant for educational and entertainment purposes only. I or my affiliates may hold positions in securities mentioned in the blog. Please see my Disclosure page for full disclaimer.
- English (UK)
- English (India)
- English (Canada)
- English (Australia)
- English (South Africa)
- English (Philippines)
- English (Nigeria)
- Deutsch
- Español (España)
- Español (México)
- Français
- Italiano
- Nederlands
- Português (Portugal)
- Polski
- Português (Brasil)
- Русский
- Türkçe
- العربية
- Ελληνικά
- Svenska
- Suomi
- עברית
- 日本語
- 한국어
- 简体中文
- 繁體中文
- Bahasa Indonesia
- Bahasa Melayu
- ไทย
- Tiếng Việt
- हिंदी
A Few Bright Spots In Crude Oil
Published 11/17/2013, 01:41 AM
Updated 07/09/2023, 06:31 AM
A Few Bright Spots In Crude Oil
Latest comments
Loading next article…
Install Our App
Risk Disclosure: Trading in financial instruments and/or cryptocurrencies involves high risks including the risk of losing some, or all, of your investment amount, and may not be suitable for all investors. Prices of cryptocurrencies are extremely volatile and may be affected by external factors such as financial, regulatory or political events. Trading on margin increases the financial risks.
Before deciding to trade in financial instrument or cryptocurrencies you should be fully informed of the risks and costs associated with trading the financial markets, carefully consider your investment objectives, level of experience, and risk appetite, and seek professional advice where needed.
Fusion Media would like to remind you that the data contained in this website is not necessarily real-time nor accurate. The data and prices on the website are not necessarily provided by any market or exchange, but may be provided by market makers, and so prices may not be accurate and may differ from the actual price at any given market, meaning prices are indicative and not appropriate for trading purposes. Fusion Media and any provider of the data contained in this website will not accept liability for any loss or damage as a result of your trading, or your reliance on the information contained within this website.
It is prohibited to use, store, reproduce, display, modify, transmit or distribute the data contained in this website without the explicit prior written permission of Fusion Media and/or the data provider. All intellectual property rights are reserved by the providers and/or the exchange providing the data contained in this website.
Fusion Media may be compensated by the advertisers that appear on the website, based on your interaction with the advertisements or advertisers.
© 2007-2024 - Fusion Media Limited. All Rights Reserved.
