The housing market probably sends out more economic indicators than any other part of the economy. There are new home sales, exiting home sales, new starts, permits, pricing data….And it seems to be all over the board all the time. I don’t know how anyone can use that data.
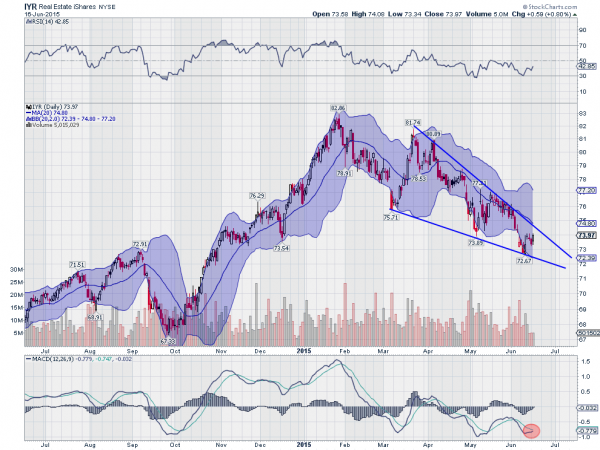
But the price of real estate stocks can be a lot simpler to understand. Maybe this is a better way to judge the health and direction of the real estate world. The chart below is a good place to start. The Real Estate iShares (ARCA:IYR) ETF looks to measure this.

Analyzing this chart reveals some potential for good news in the sector, despite the price of the ETF being down over 12% from its peak in January. The price action since March has been creating a falling wedge pattern. This is often a bullish reversal pattern.
It would start with a break over the top of the wedge near 74.40. Then there would be a target to the upside of 80.40. The momentum indicators are showing a bullish divergence, with the RSI turning back higher and the MACD about to cross up. If these continue and the price moves over 74, it is time to set an alert for the wedge to break to the upside and build strength in housing stocks.
Disclaimer: The information in this blog post represents my own opinions and does not contain a recommendation for any particular security or investment. I or my affiliates may hold positions or other interests in securities mentioned in the Blog. Please see my Disclaimer page for my full disclaimer.
