How many of you can remember when US Treasury Bonds were physical pieces of paper, with coupons attached to them? I do not mean the Series E savings bonds you may have received at your birth, but the real deal $1 million variety. In the 1980’s I started working in banking at Chase Manhattan Bank (now JP Morgan) at Chase Plaza in New York City. I remember those physical bonds because they were stored right around the corner from me, on the 4th floor of the basement, 1 floor above the gold bars. It was part of ‘Banking’ that there was an army of runners with carts loaded with bonds navigating the narrow streets as they delivered bonds to a new bank to settle a transaction. Working in the room with the bonds, I had to walk through double lock security, leaving everything except the clothes on my back to ensure that I did not walk out with some bonds. Those were the days!
And that is when the Bond Market rally began. For the next 30 years prices of bonds would move higher. The mega trend created bond kings like Bill Gross and Jeff Gundlach, who basically bought more and more bonds for their clients as the prices continued higher. Genius. Despite the October 1987 crash, the Dotcom crash and the Financial Crisis, US Treasury Bonds kept going up. The pile of US debt continued to increase at a tremendous pace, yet the price of Treasury Bonds kept going up. Recently the Federal Reserve stopped pumping cash into the world economy and Bond prices still went up.
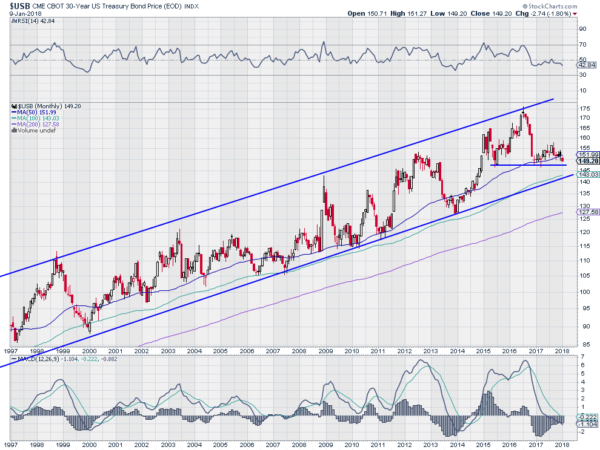
For the past 5 years the experts have been calling for the end of the 30 year bull market in Treasury Bonds, and it has not come. So why would it happen now? Clearly the experts could identify when prices were rising through the 80’2 90’s and 2000’s so why not now? The chart above shows the price of US Treasury Bonds over the last 20 years. There has been fluctuation but they have continued to rise in a channel. The long term uptrend is far from being at risk, but the shorter term is showing some weakness. The rally from the June 2015 low stopped out at the top of the channel in July 2016. Since then the drop came fast, but found support at the price level as in 2015. A weaker bounce ensued and now prices are falling again toward that support level.
A drop in prices below 147.50 (or 147-16 for the old timers) would make a lower low and confirm a short term downtrend. Continuation below the 50 month SMA and the bottom of the rising channel would add weight to the argument for a bearish turn. For that to happen Expect to see the RSI fall below 40 and continue lower. Also look for the MACD, which appears to be leveling, to stop and continue to the downside. Continuation below the 100 month SMA, currently at about 127.50 would likely see sellers flood the market. Until you see all of these signals the Bond Market Bull market remains.
The information in this blog post represents my own opinions and does not contain a recommendation for any particular security or investment. I or my affiliates may hold positions or other interests in securities mentioned in the Blog, please see my Disclaimer page for my full disclaimer.

