Crude oil makes the world go around. Sure, there is a push to use renewables like solar energy. And natural gas heats almost every mid-western home. But crude oil is king. Wars are fought over it. Economies built upon it. It is black Gold. Some day that might all change, but it does not look to be anytime soon. And for the time being, crude's price looks ready to squeeze users – and line the pockets of producers.
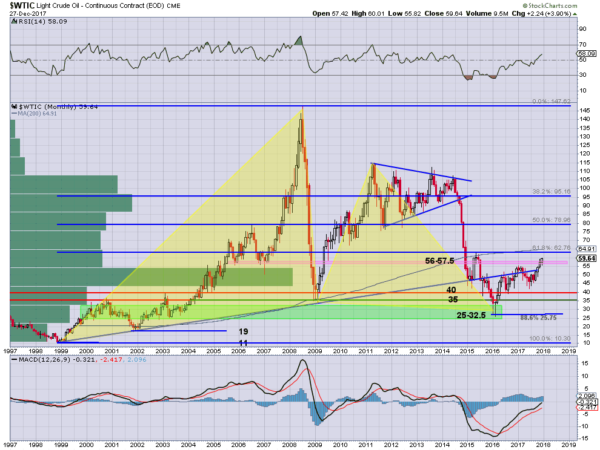
The long term chart below tells the story.
This chart shows the price of crude oil going back 20 years. The first item to note on it is the long rising trend support line that held it up until 2015. With a couple of major rallies and failures, this rising trend acted as support 4 times until failing and watching price fall through it in 2015. The extension since then has also proven to be important. First in 2016 as resistance and then a push back over it. But the price has yet to make any major separation from that trend line.
Targets
And part of that might be that the price range from $44 to $54 shows nearly three times as much trading history as any other range. It took a long time to erase memory and positions established against that range. But now it is moving higher. A first target comes from the Bat harmonic, the 2 yellow triangles. it is a bullish reversal pattern that triggered as it crossed an 88.6% retracement of the major rise from the 1999 low to the 2008 high. The first target on the reversal is to 62.75, a 38.2% retracement of the entire pattern, with a second target to 95.15 above that or a 61.8% retracement.
That first target is also at the 200-week SMA, with a move over that building the bullish status and reversing the weakness since 2014. Momentum is on the bull side. The RSI is moving higher off of the mid line deeper into the bullish zone. The MACD has been rising since the beginning of 2016 and is now about to cross to positive. With momentum at its back, and little price history a long run higher could ensue. A move over 62.75 seems to be the key to its future.

