After opening near the flat line yesterday (September 4), stocks sold off in the morning, but afternoon buying interest enabled the main stock market indexes to reverse back up. By the closing bell, major divergence in the broad market caused the major indices to finish with substantially mixed results.
The blue-chip Dow Jones Industrial Average (DJIA) posted a 0.4% loss and the S&P 500 Index (SPX) edged 0.1% lower. However, small and mid-cap issues showed impressive relative strength yesterday. The small-cap Russell 2000 (RUT) and S&P MidCap 400 (MID) rallied 1.2% and 1.1% respectively. The Nasdaq Composite (COMPQ) registered a more modest gain of 0.3%. The bulls held the upper hand into the close, as stocks closed near their intraday highs.
Although the closing prices of the main stock market indexes were rather mixed yesterday, make no mistake that it was indeed an overall bullish trading day. For starters, stocks managed to shake off significant morning selling and subsequently recover all the way back to test their intraday highs. Afternoon strength and resilience is a common trait of healthy markets. But even more important was the clear relative strength of small-cap stocks.
Most of the stocks we buy (only in uptrending markets) are small and mid-cap growth stocks because they have the greatest potential to exhibit sharp upward price momentum in uptrending markets. But even most industry sector ETFs tend to perform better and trend smoother when small and mid-cap stocks are leading the broad market.
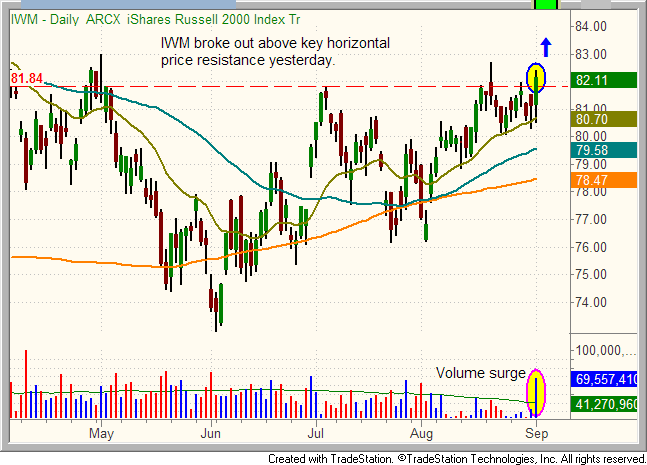
The institutional money flow into small-cap stocks yesterday caused iShares Russell 2000 Index (IWM) to break out above a key level of horizontal price resistance yesterday. Confirming the move was a surge in volume, which shot well above its 50-day average level. The IWM breakout is shown on the daily chart pattern below:
Given the high volume breakout in IWM yesterday, we are now stalking ProShares Ultra Russell 2000 (UWM) for potential swing trade buy entry going into today’s session. For those not familiar with ProShares ETFs, UWM is simply the 2X leveraged version of IWM. Over longer-term holding periods, most leveraged ETFs usually underperform their non-leveraged siblings. However, the long-term underperformance that arises from daily rebalancing of the portfolios of leveraged ETFs is not much of an issue with the shorter-term, momentum-based trades that we focus on.
If it triggers our preset entry price, buying UWM in our model ETF trading portfolio, rather than IWM, ties up less capital. Still, we will use IWM as the proxy for getting our buy and sell signals for this trade set up, then use corresponding entry and exit prices for trading UWM instead. Subscribers should note our detailed entry, stop, and target prices for this new ETF trade setup in the “ETF Watchlist” section of today’s newsletter.
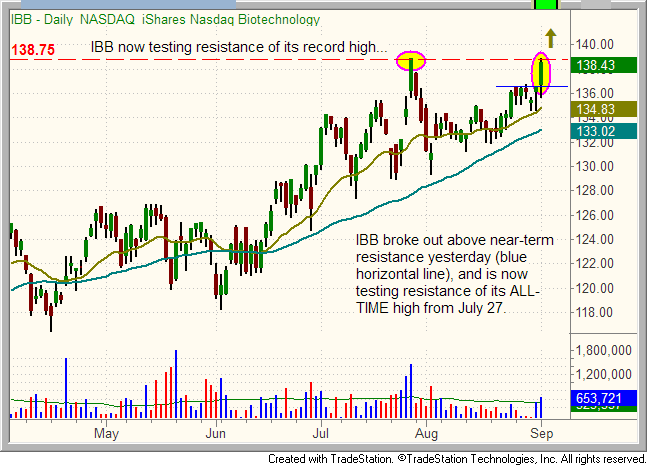
All three of our current open ETF positions advanced yesterday. The biggest gainer was iShares Nasdaq Biotechnology ETF (IBB), which broke out above its recent consolidation and cruised 1.5% higher. The ETF is now testing resistance of its all-time high, which was set on July 27, 2012.
Given the increasing volume of this ETF, combined with ongoing relative strength in the healthcare sector, we expect IBB to soon break out to a new record high. Although we have already been holding our initial entry in this ETF for the past three weeks, our patience is starting to pay off. Take a look: 
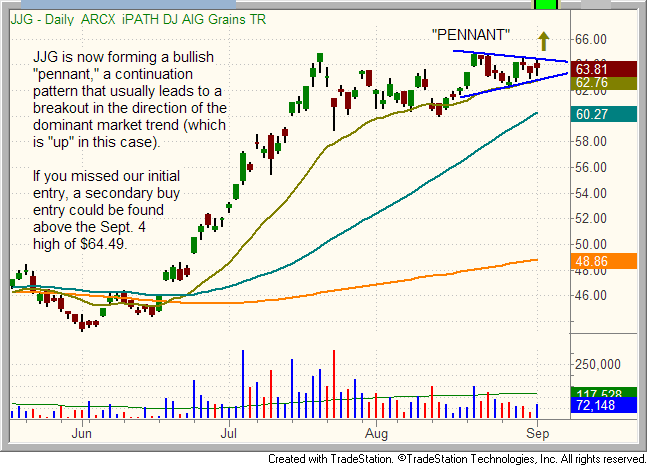
The iPath Grains Trust (JJG), a commodity ETF we have been long since August 29, rose 0.5% yesterday and continues to exhibit a nice daily chart pattern. On the chart below, notice the bullish “pennant” formation JJG has been forming, while the 20-day exponential moving average (beige line) has been perfectly acting as support. This should eventually lead to a breakout to new highs in the coming days:
DB Gold Double Long (DGP), a gold ETF we bought when it broke out on August 31, digested the previous days sharp gains, while still managing to rise 0.3%. We expect bullish momentum to carry gold ETFs substantially higher, both in the short term and intermediate-term, but we plan to sell DGP into strength before the first correction occurs, then look to re-enter after it forms a bull flag or a base of price consolidation.
Original post
- English (UK)
- English (India)
- English (Canada)
- English (Australia)
- English (South Africa)
- English (Philippines)
- English (Nigeria)
- Deutsch
- Español (España)
- Español (México)
- Français
- Italiano
- Nederlands
- Português (Portugal)
- Polski
- Português (Brasil)
- Русский
- Türkçe
- العربية
- Ελληνικά
- Svenska
- Suomi
- עברית
- 日本語
- 한국어
- 简体中文
- 繁體中文
- Bahasa Indonesia
- Bahasa Melayu
- ไทย
- Tiếng Việt
- हिंदी
A Deceivingly Strong Trading Session, As Small-Cap Stocks Break Out
Published 09/05/2012, 04:57 AM
A Deceivingly Strong Trading Session, As Small-Cap Stocks Break Out
Latest comments
Loading next article…
Install Our App
Risk Disclosure: Trading in financial instruments and/or cryptocurrencies involves high risks including the risk of losing some, or all, of your investment amount, and may not be suitable for all investors. Prices of cryptocurrencies are extremely volatile and may be affected by external factors such as financial, regulatory or political events. Trading on margin increases the financial risks.
Before deciding to trade in financial instrument or cryptocurrencies you should be fully informed of the risks and costs associated with trading the financial markets, carefully consider your investment objectives, level of experience, and risk appetite, and seek professional advice where needed.
Fusion Media would like to remind you that the data contained in this website is not necessarily real-time nor accurate. The data and prices on the website are not necessarily provided by any market or exchange, but may be provided by market makers, and so prices may not be accurate and may differ from the actual price at any given market, meaning prices are indicative and not appropriate for trading purposes. Fusion Media and any provider of the data contained in this website will not accept liability for any loss or damage as a result of your trading, or your reliance on the information contained within this website.
It is prohibited to use, store, reproduce, display, modify, transmit or distribute the data contained in this website without the explicit prior written permission of Fusion Media and/or the data provider. All intellectual property rights are reserved by the providers and/or the exchange providing the data contained in this website.
Fusion Media may be compensated by the advertisers that appear on the website, based on your interaction with the advertisements or advertisers.
© 2007-2025 - Fusion Media Limited. All Rights Reserved.
