As it turned out, the US Dollar index didn’t reverse yesterday. Instead, it declined further and reached the 92.50 level, while gold responded with a rally as a result. And yet–that’s still bearish and in line with what I wrote yesterday.
But why is that? How could it be that a daily rally in gold is bearish? The answer is simple – it’s not the rally in gold that’s bearish, but what it had caused. More precisely, what it hadn’t caused. It didn’t make miners rally to any similar extent.

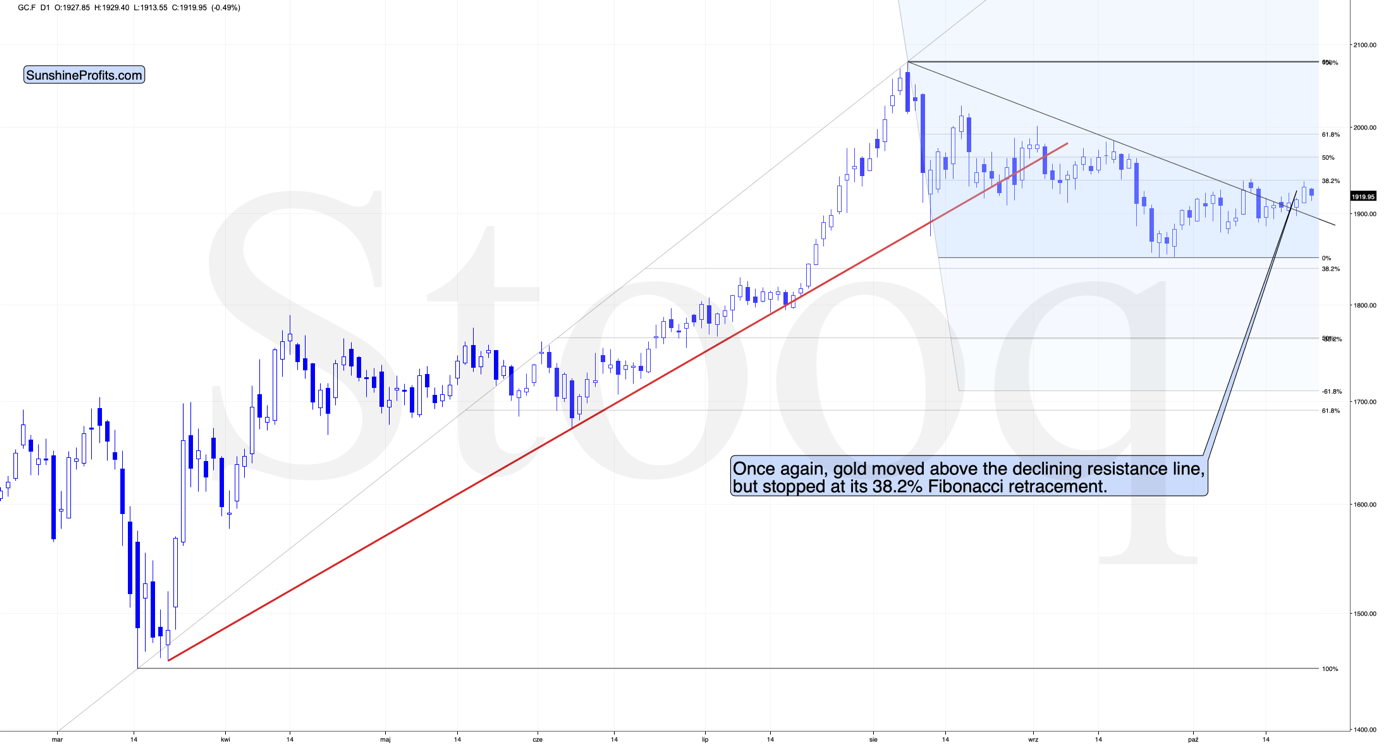
Based on the recent decline, gold touched its October highs and, once again, tested its 38.2% Fibonacci retracement level. This resistance held on, and therefore, the upswing that we’ve witnessed this month is nothing but a corrective upswing.
The breakout above the declining short-term resistance line is a quite bullish sign on its own, especially since gold managed to hold above it for a few days. To be a little more specific–this would have been a bullish indication if it wasn’t balanced by equally or more important new signals coming from the mining stocks.

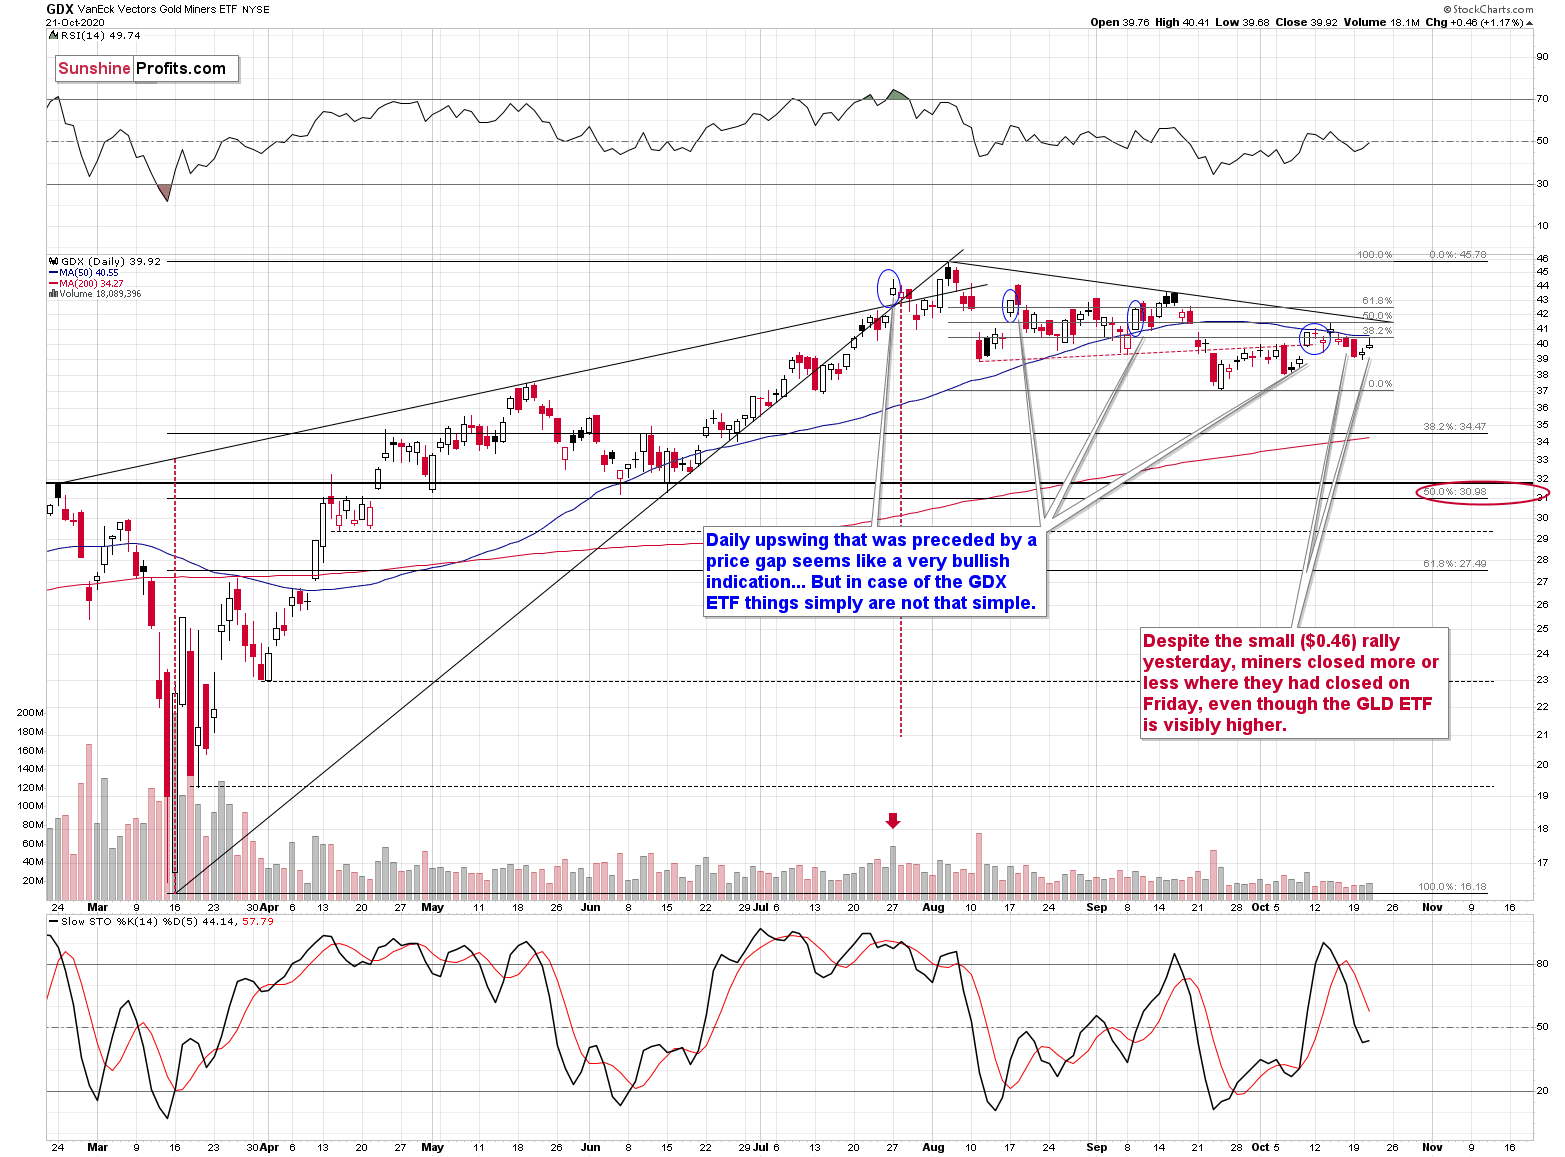
Yesterday, the GDX ETF (which we’ll use as a proxy for the sector) moved higher ($0.95) but gave away most of its gains ($0.49) before the session was over, ultimately closing merely $0.46 higher. This means that miners have barely closed above their Friday’s closing price. As a matter of fact, they didn’t even move close to the October high.
Miners’ weakness is something that heralds precious metals market declines, and such was the case back in early March. As you can see on the chart above, the GDX ETF didn’t move back to its previous highs in March–even though at the same time, gold moved slightly above its previous highs. And we are all well aware of the carnage that followed.
Now, you might be thinking that comparing gold and miners is not a true apples-to-apples comparison, as their closing time is different. That’s true, so let’s see how the GLD ETF performs–its closing price is the same as the one of the GDX ETF.

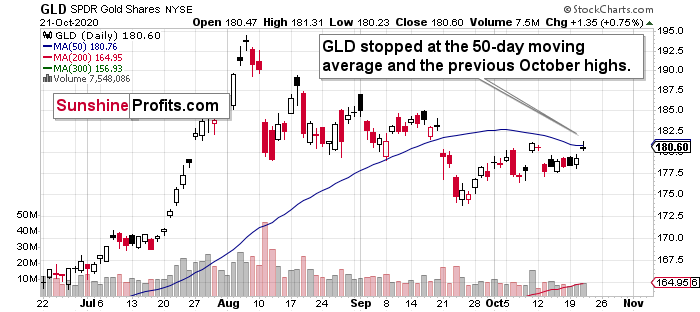
The GLD ETF chart is even better in showing us that yesterday’s closing price is visibly above last Friday’s close. Therefore, the argument about miners’ severe underperformance is a valid one.
Moreover, please note that the above chart shows us that the GLD is currently testing its October highs and its 50-day moving average. Back in early September, this MA served as support, and when it was finally broken in mid-September, it was then followed by a quite visible decline. This makes it quite a potent resistance right now, and it’s no wonder that gold is down in today’s pre-market trading.
Additionally, please also take into account that the GLD bounces off relatively similar price levels. In August and early September, the 180-level and its surrounding served as support, and subsequently–in October–it served as resistance. There’s a good reason why that’s the case.

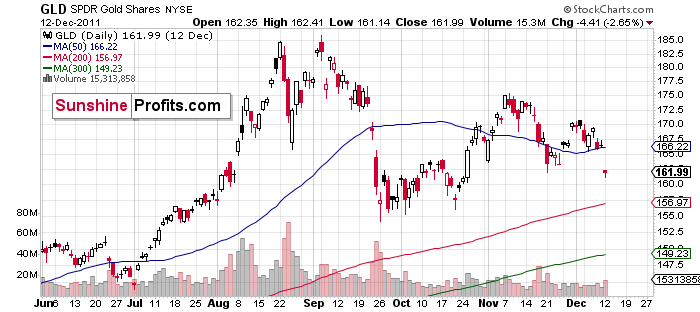
Namely, these are the levels that stopped GLD’s rally back in 2011. This is where we saw the ultimate top. It formed a bit north of $180, but the overall area remains the same.
And what are the implications for the current situation because of it? That the resistance that gold and GLD just reached is stronger than it appears at first sight.
Currently, gold is trying to climb back above its 2011 highs, and the attempt is not a successful one for now. Even at the moment of writing these words, gold futures are trading below their 2011 high.
So… Is there any other indication that gold and miners are about to turn south? You bet!
