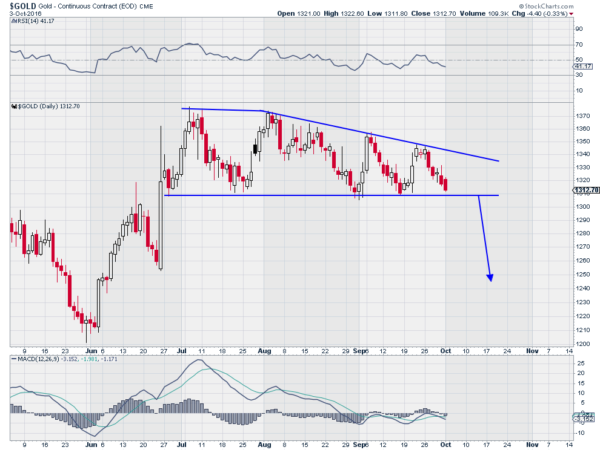
The price of gold has been doing quite well since January. From a low bout 1060 per ounce to start the year, gold was up to almost 1400. That is better than a 30% return. But since making a high in the beginning of July it has done nothing. Or worse than nothing.

The chart above shows a series of lower highs, against support at 1310. That has defined a descending triangle. A break below 1310 would give a target to the downside to about 1245. From there, the June low at 1210 would not be far off. Will it break down?
The momentum indicators certainly support it. The RSI is moving lower and on the edge of a move into the bearish zone. The MACD is crossed down and is falling. Both support more downside. But both have been in this position before only to see gold reverse higher off of the 1310 support. This would be the 5th touch at support. Technicians like to say the more tests at a price level the more likelihood it breaks though. 5th time a charm?
