
The NYSE Composite, Dow Jones, S&P 500, Nasdaq and Russell 200 have all been making slight higher highs in recent months. This rise has been "technically weak", as fewer and fewer stocks continue to advance since the summer highs. However, today I will not focus on breadth, but another non-confirming indicator: the VIX.
Chart 1: VIX has refused to make lower lows and gearing for a break out!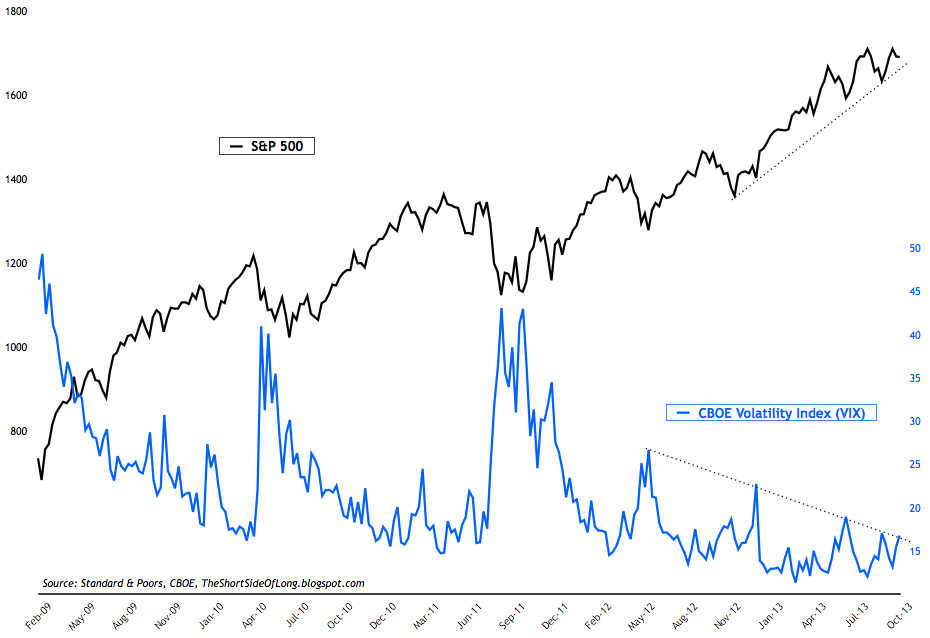
Interestingly, the VIX has stopped going down for awhile now and is not confirming new highs in the S&P 500 (and other US indices). The chart above shows a stalled market with only marginal new highs, while the VIX is triangulating into a pressure cooker... a decision point!
Chart 2: Longer term chart shows a major compression in the VIX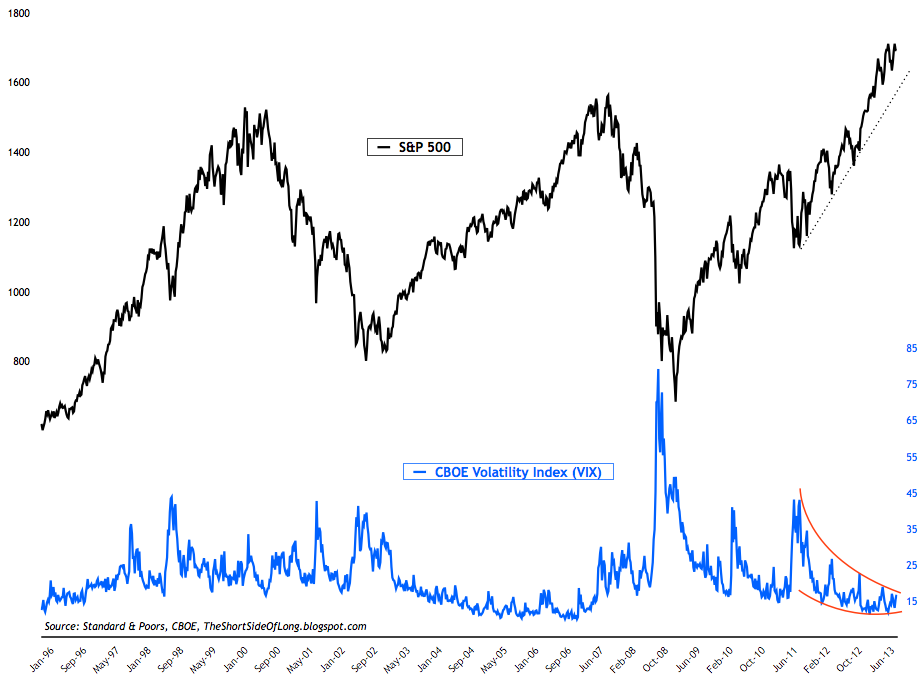
The longer term chart shows a major compression in the price of the VIX too. Essentially, we have a major triangulated setup around the level of 15. In my opinion, a decision break in either direction will be made sooner rather than later, as the VIX will not trade sideways forever. Make sure you watch the Volatility Index closely over the coming days and weeks.
- Are investors expecting the VIX to break out on the upside?
It really depends who you ask. If one was to listen to the advice by various investment pundits on business media channels, investors are constantly being bombarded with skewed views of sentiment. The prevailing belief is that majority of investors are bearish on stocks due to the US government shutdown.
Chart 3: Investment advisors see no reason to be bearish right now...
However, if we focus on the chart above, we can see that investment advisors and newsletter writers do not seem concerned at all. Only 18.6% of the overall group are actually bearish on stocks. In other words, less then a fifth are concerned that the stocks will sell off and volatility will increase. From a contrarian point of view, this could be a signal that volatility just might rise. After all, Investor Intelligence bearish readings correlate closely to the VIX.