In a post on Sep. 30, I noted that the banking sector (BKX) had begun to show relative strength, a ramification of which was that my Gold True Fundamentals Model (GTFM) had shifted from bullish to bearish. An update is warranted because the situation has changed since then in a way that is both interesting and a little surprising.
Just to recap, the relative performance of the banking sector (as indicated by the BKX/SPX ratio) is an input to my “true fundamentals” models for both the US stock market and the gold market, the difference being that when the input is bullish for one of these markets it is bearish for the other. In particular, relative weakness in the banking sector is considered to be bullish for gold and bearish for general equities.
As explained in the above-linked post, there was enough relative strength in the banking sector during the first half of September to flip the BKX/SPX input from gold-bullish to equity-bullish, causing the GTFM to shift from bullish to bearish. My guess at the time was that the GTFM would return to gold-bullish territory within the next two months, but I pointed out that it is usually better to base decisions on real-time information than on what might happen in the future.
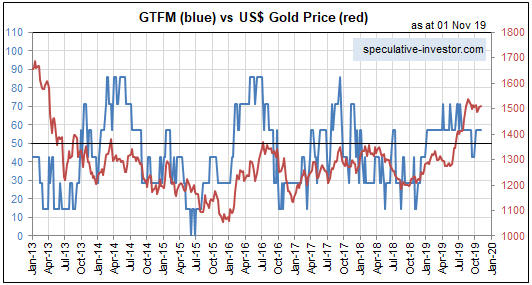
Within a few days of my 30th September post the GTFM shifted back to bullish, where it remains today. This means that apart from a 3-week period during September, the fundamental backdrop has been supportive for gold since the beginning of this year. Refer to the following chart for more detail (the fundamental backdrop is gold-bullish when the blue line on the chart is above 50). Furthermore, there is evidence in the recent price action that gold’s correction is over. However, the fundamental and technical signs of strength in the gold market were not accompanied by signs of weakness in the banking sector.

What’s both interesting and a little surprising is that the renewed signs of strength in gold have gone hand-in-hand with additional signs of strength in the banking sector. Specifically, since my 30th September post the BKX has broken out to the upside (refer to the top section of the following weekly chart) and the BKX/SPX ratio has broken a sequence of declining tops that dates back to early last year (refer to the bottom section of the following chart).
The BKX/SPX ratio is just one of seven inputs to the GTFM, so there are circumstances in which the gold price can trend upward along with relative strength in the banking sector of the stock market. In other words, it isn’t out of the question that over the next few months we will get a gold rally in parallel with a continuing rise in the BKX/SPX ratio and strength in general equities. It’s more likely, however, that the emerging signs of strength in gold are warning of a short-term reversal to the downside in both the broad stock market and the banking sector.
