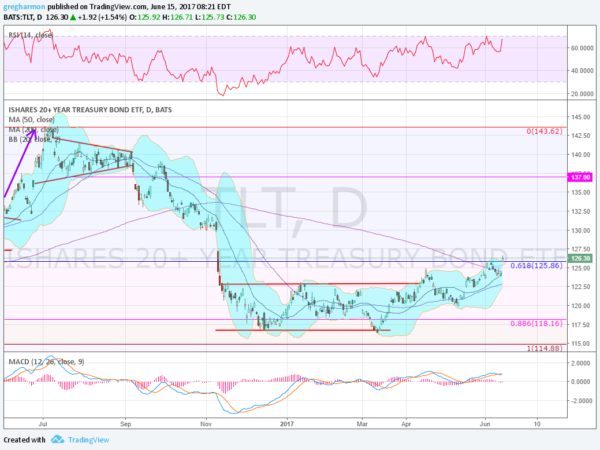
The chart below shows the daily price action of the last 12 months of the iShares 20+ Year Treasury Bond (NASDAQ:TLT) It started moving lower in July 2016 after completing a 3 Drives pattern. The bottom came after a gap down following the election and subsequent 88.6% retracement of that pattern. It settled into a sideways consolidation then that lasted 5 months before peaking over the top of the range. A pullback to a higher low found support and reversed up above the range again. At the beginning of June it moved back over its 200 day SMA for the first time since October.

That brings up to the present. On the short term chart the price action is rounding out a bottom as it moves back over the 61.8% retracement level and nears the gap from the election. This is the real test of strength for Bonds. Can they get into and close the gap? It takes a move over 127.35 to get into the gap and to 130 to close it. Momentum supports more upside but the move Wednesday left a sizable gap to fill below. What about on a longer view?

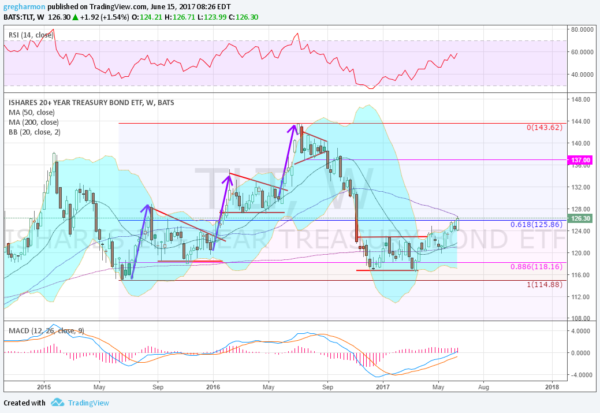
The weekly candles on the chart above also suggest rounding out of a bottom. There are a few additional things to note. First the gap on the daily chart shows as a long red candle. This shows little price history in that range on the way down. Coupled with the above average volume for 6 weeks suggests a large amount of liquidation. Not new short, long holders selling.
Now look at the second triangle of the 3 Drives that took it higher. The bottom of that triangle is right at the top of the daily chart gap. The churn that happened there could hold any move higher for some time as it works through historical price action. This sets the 130 price as a key level to exceed to prove strength on the longer timeframe. Finally, the RSI is still not back to the bullish range. A move over 60 would change that.
A turn around in Treasuries is clearly underway. Keep your eye on the 127.35 and 130 price levels though. Until it can get over those levels this could still be nothing more than a bull trap for bond holders. If you just can’t help yourself at least keep a stop loss at the top of the prior bottoming consolidation range at 123.
The information in this blog post represents my own opinions and does not contain a recommendation for any particular security or investment. I or my affiliates may hold positions or other interests in securities mentioned in the Blog, please see my Disclaimer page for my full disclaimer.
