What the economic calendar lacked in volume, it made up for with importance: this past week, two important coincident indicators reported positive results. Industrial production rose for the 3rd time in 6 months, this time by .6%. Better still, the previous decline of .4% was revised to an increase of .2%. All major industry groups contributed to the rise: manufacturing increased .4% (although it dropped 1% annually), mining was up .2% (it’s second consecutive rise) and utility output rose 2.4%. The retail sector provided additional good news: sales rose .6% M/M. Like the industrial production report, activity increase in a number of sub-categories.
The Atlanta Fed’s GDP now forecast projects 2nd quarter growth of 2.4% while the NY Fed’s GDP “Nowcast” predicts 2.2%, making their average a moderate 2.3% pace.
Economic Conclusion: Industrial production and retail sales are coincident indicators used by the NBER to date recessions. Industrial production declined for the last 15 months due to oil’s price collapse and the strong dollar. While two consecutive increases isn’t necessarily a forerunner of continuing improvement, it is, at minimum, a potential sign that the industrial recession is over, especially when considered with the recent series of positive PMI readings. Retail sales weren’t declining like industrial production, but they were stagnant from July 2015 through March 2016, moving sideways in the latter half of 2015 and engaging in a “two steps forward, one step back” pattern for the first quarter of 2016. But they’ve made strong gains in the last three months, reaching post-recession highs in the latest report.
Market Overview: For the last 12-18 months, I’ve been slightly bearish thanks to the combination of an expensive market and declining earnings. Today, I want to discuss the market’s expensive price, but from a different perspective.
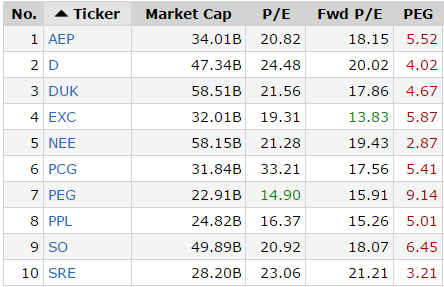
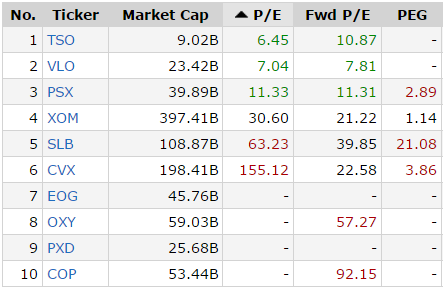
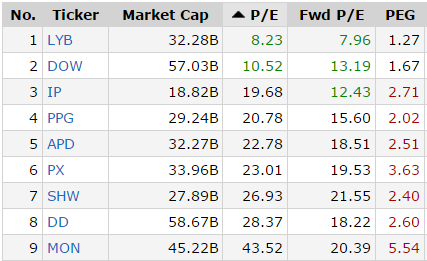
Rather than look at the overall market’s valuation, I’ll look at the PE, forward PE and PEG ratio of the 10 largest holdings of the three sectors that have performed the best since start of the year: utilities (Utilities Select Sector SPDR (NYSE:XLU), up 16.28%); energy (Energy Select Sector SPDR (NYSE:XLE), up +10.59%); basic material, (Materials Select Sector SPDR (NYSE:XLB) up +7.54%). The tables are from the FINVIZ website.
Utilities:

Notice the extreme overvaluation, caused by investors reaching for yield and safety. Only three of the largest holdings—Exelon Corporation (NYSE:EXC), Public Service Enterprise Group (NYSE:PEG) and PPL Corporation (NYSE:PPL)—have a PE below 20. While the forward PEs are slightly better the PEGs are through the roof, indicating that none of these securities is a bargain.
Energy:

Four of the largest holdings have no PE—EOG Resources Inc (NYSE:EOG), Occidental Petroleum Corporation (NYSE:OXY), Pioneer Natural Resources Company (NYSE:PXD) and ConocoPhillips (NYSE:COP). Only three of these stocks have a forward PE below 21—Phillips 66 (NYSE:PSX), Exxon Mobil Corporation (NYSE:XOM) and Chevron Corporation (NYSE:CVX)— and the PEG ratios are either expensive or non-existent.
Basic Materials:

Only three of the XLB's largest holdings have a PE below 20—LyondellBasell Industries NV (NYSE:LYB), Dow Chemical Company (NYSE:DOW) and International Paper Company (NYSE:IP); only two have a PEG below two, LYB and DOW.
Finally, two of these sectors – basic materials and utilities – are typically lower PE sectors. That shows just how pricey equities are right now. And this high valuation continues to make me be slightly bearish.
