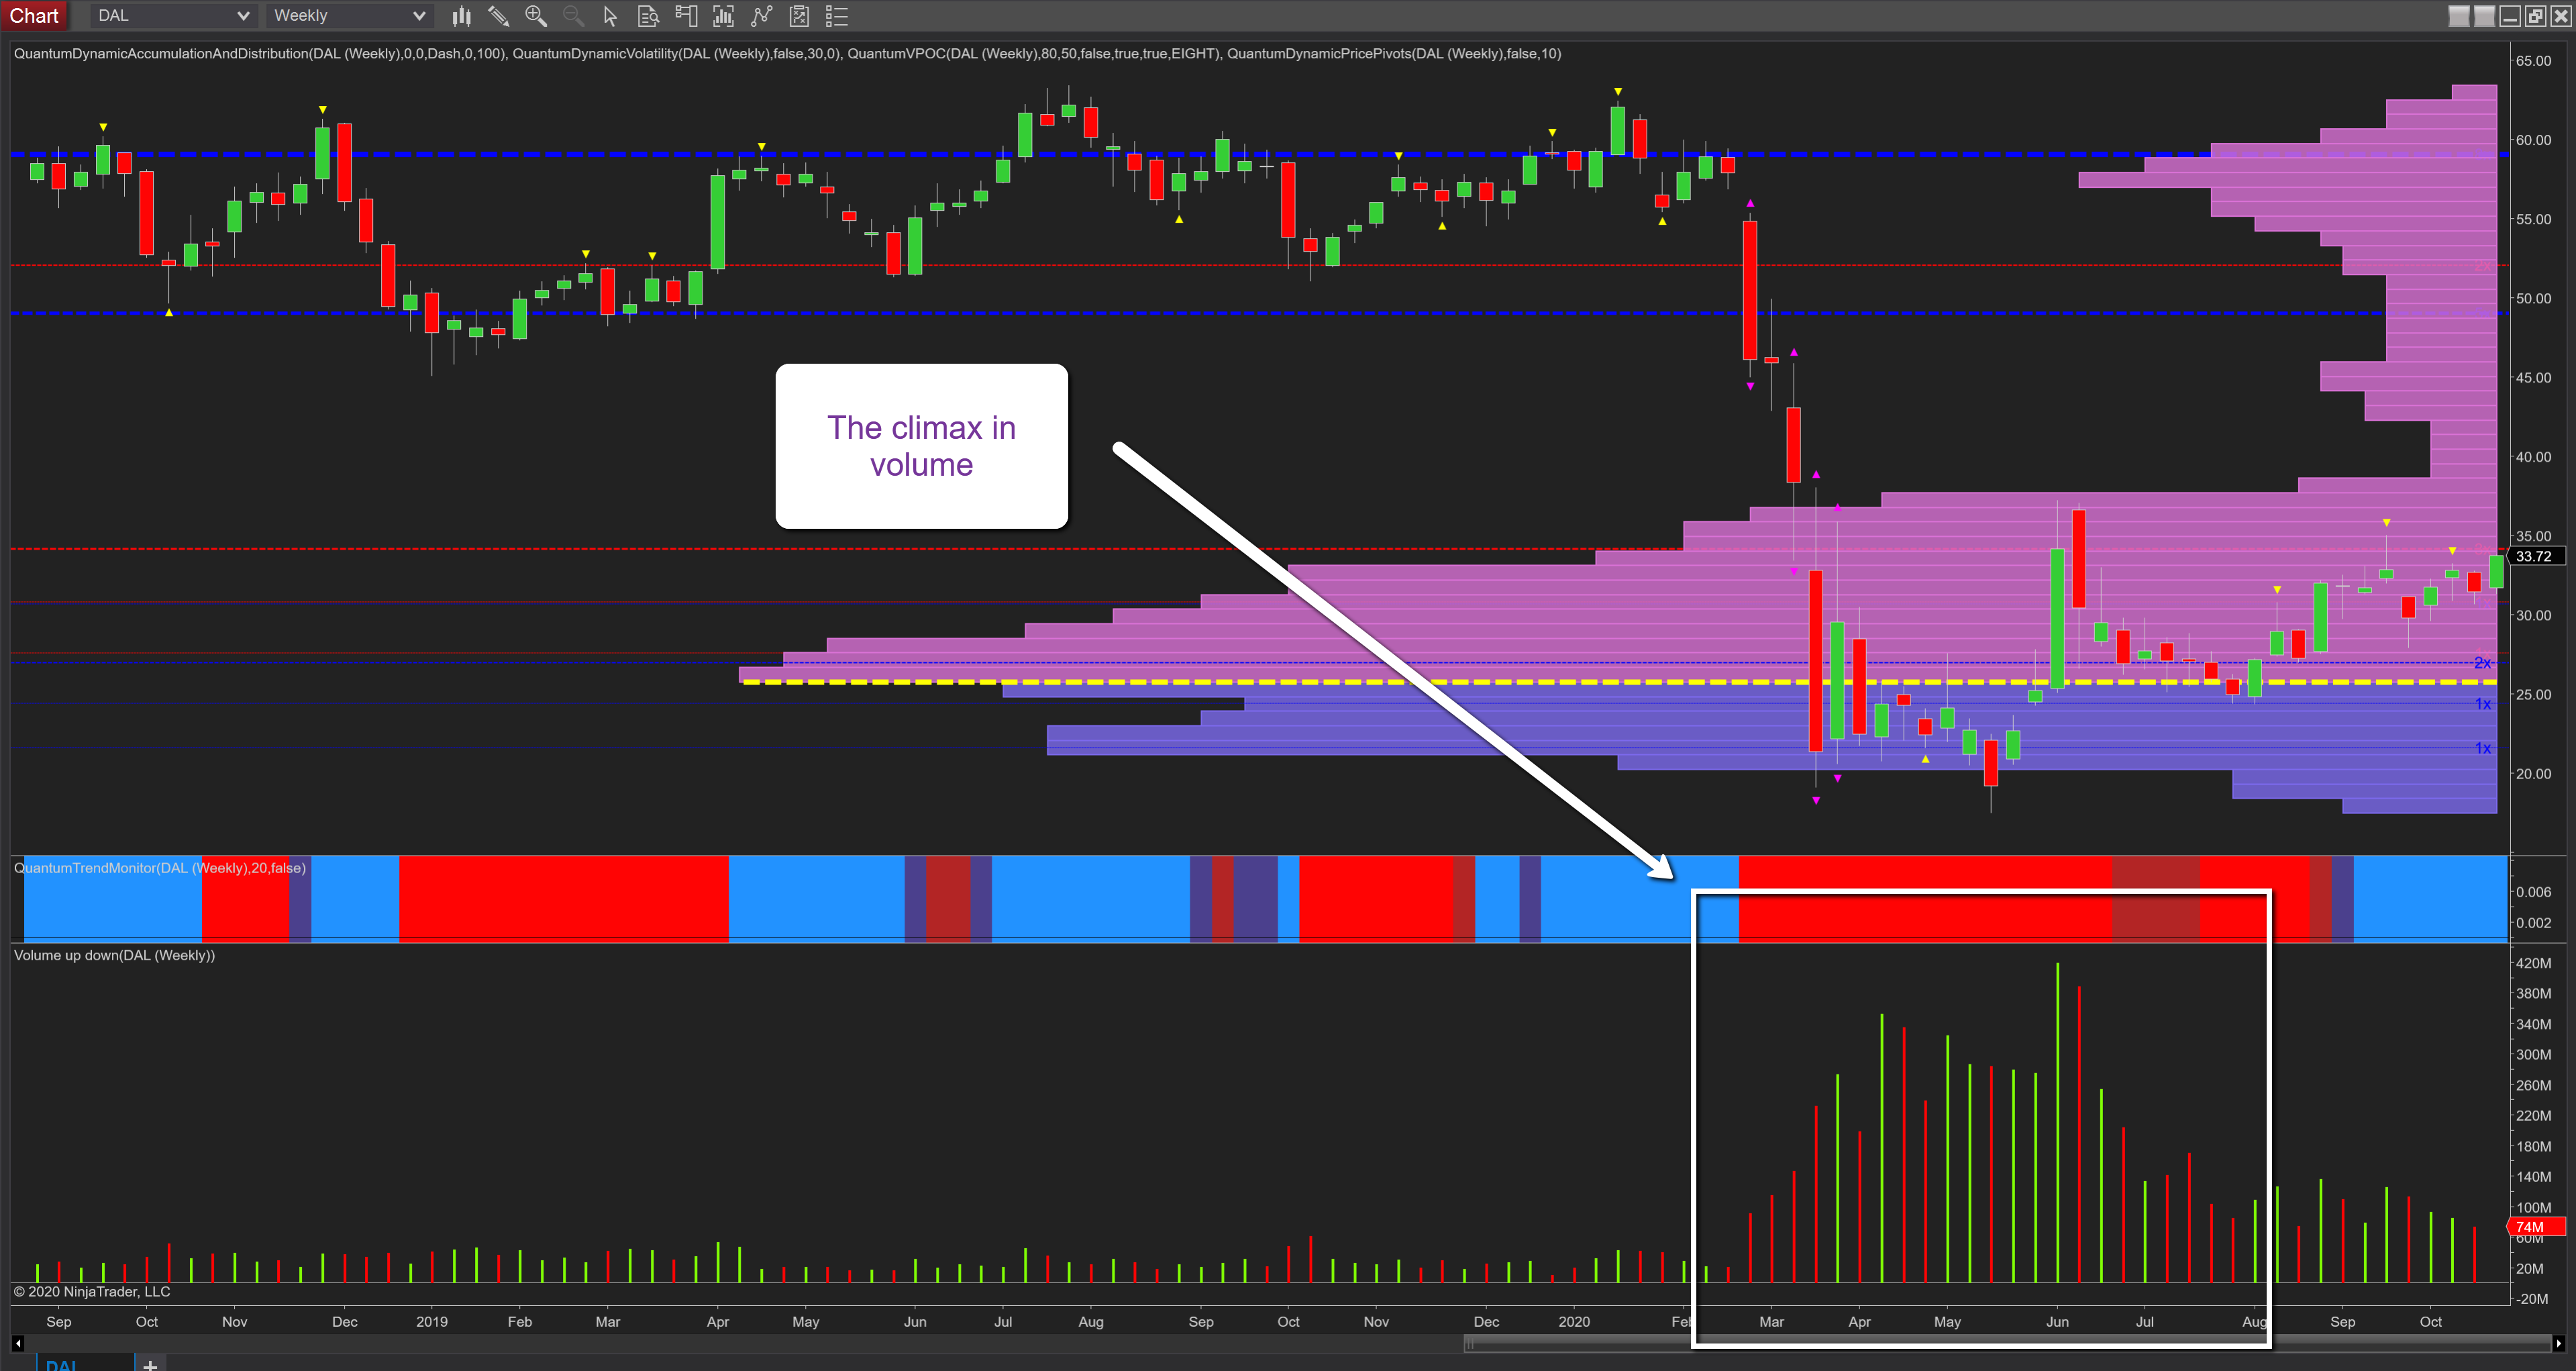
I’ve been meaning to analyze this stock for some time, as it is a classic chart for several reasons, not least because it represents one of those sectors currently being battered by the pandemic, but from a vpa perspective the weekly chart delivers a wonderful example of the type of price action and associated volume we can expect to see in a buying climax.
Perhaps if we start with what is self-evident even with a cursory glance, and this is the huge increase in volume which occurs as the pandemic takes hold from late February with the Delta Airlines (NYSE:DAL) stock plunging on rising volume. However, what follows is the dramatic whipsaw price action with surges in volume as yet more stock is accumulated by the market makers, and note how the selling pressure finally diminishes as the price action moves into the summer months and the volume surges begin to calm as price oscillates around the volume point of control at $25 per share.
Then into September and October, we begin to see the steady progress higher as the price begins to climb and move away from this dramatic area and develop a bullish trend as we now start to focus on levels.
At the time of writing the stock is testing the resistance in place at $34 per share and denoted by the red dashed line of the accumulation and distribution indicator. But if this is breached, as expected, there is no price based resistance ahead, and with the volume also falling away on the VPOC histogram this is good news and likely to lead to some calmer price action as the stock advances through the $40 to $45 per share and up to the next level of resistance which is stronger at just below $50 per share and denoted with the blue dashed line.
So certainly a stock that looks set to rally in the longer term and with analysts forecasting a gentle rise in sales and revenues to around $28 billion, certainly one where the recent battering has calmed. This pattern of price action is classic and can be thought of as a series of tidal waves, which crash onto the shore, returning repeatedly. but each time a little weaker, before they finally die away.
Another pattern I would search out is the saucer where prices had fallen for an extended period, then move into consolidation and finally, the slow recovery begins. In this case, patience is required but for longer-term wealth building can be a profitable approach. And of course, in all these phases of price action, I am always looking for low volume tests as a signal the market is preparing to launch a new campaign.
