In many ways, 2013 has started off like 2012. Long term Treasury bond rates started 2012 at 2.9% and spiked to 3.5% by April 19. That was the peak and they finished the year practically unchanged. We began this year with the yield at 2.95% and by April 11 they hit 3.28%. Rates have already tumbled to 2.84%. The S&P500 rose 12% in Q1 2012, peaking on April 2 and making practically no progress for the rest of the year. This year the S&P 500 rose 10% in Q1 and peaked (so far) on April 11. At this time last year my most important question from an investment standpoint was: Is the back up in rates a mere correction or a slippery slope? Is the almost unanimous opinion that the Great Bull Market in Bonds is over correct? A secondary (and closely related) question was: What is the outlook for the economy and the stock market? Apparently, no matter how much things change, the questions remain the same.
First, I will try to tackle the generally accepted view that we have a bond bubble. Here is a recent quote from Robert Shiller; the famed Yale economist and author of Irrational Exuberance in USA Today on April 4, 2013:
“Irrational exuberance is the psychological basis of a speculative bubble. I will define a speculative bubble as a situation in which news of price increases spurs investor enthusiasm which spreads by psychological contagion from person to person, in the process amplifying stories that might justify the price increase and bringing in a larger and larger class of investors, who, despite doubts about the real value of the investment, are drawn to it partly through envy of others’ successes and partly through a gambler’s excitement.” The full article entitled “Beware of Those Who Cry ‘Bubble’ About Bonds” can be found by clicking here. It is brief and well worth the time to read.
Enthusiasm Missing
Today, the missing ingredient for a bubble in the bond market is investor enthusiasm. A large part of the demand for bonds is the result of the public being forced to wade out into the risk pool in order to earn a better return than that is currently available in certificates of deposit and other guaranteed investments. After all, at 0.50%, $1 million invested in a 1 year CD pays $5,000 per year in interest income. After Medicare premiums, you are left with tuna fish salad for dinner.
The dilemma for conservative investors goes well beyond low CD rates. Although yields on high quality long term bonds are reasonably attractive compared to normal spreads with inflation, the message from Wall Street is that long term bonds are risky almost to the point of being stupid, because rates have no where to go but up. Having eliminated long bonds as a choice, investors have been encouraged instead, to achieve a higher yield either in lower quality but shorter maturity bonds, or in dividend paying stocks. Because the long end of the high quality bond market is so unpopular, it is experiencing the opposite of a bubble: a level of negative sentiment that substantially reduces the market risk.
Reaching for Yield
Nevertheless, not being in a bubble does not mean that the risks are not great. As Ray DeVoe famously said, “More money has been lost reaching for yield than at the point of a gun.” The yield on junk bonds, emerging market debt, structured debt and every other type of “spread product” are at record lows, particularly in relation to risk-free Treasury securities. (“Spread product” refers to any fixed income security with default risk). In the event that the economy takes a turn for the worse, riskier bonds can drop in price even as government bonds appreciate due to a “flight to quality” and because there is a positive deflationary impact on investment grade bonds during downturns. In fact, this scenario is perfectly normal during recessions and the 2008-2009 “Great Recession” was a recent and dramatic example. In 2008, only Treasury bonds went up in price and everything else, even Coca Cola bonds got hammered. So on one hand it does seem likely that there will be some real disappointment for investors in spread product in the event that the business cycle is turning down. On the other hand the rally in the long term Treasury bonds and closed-end Municipal Bond Funds may have resumed.
There are many reasons to be concerned about the likelihood that we are once again facing at least an intermediate term top in the stock market. “Sell in May and go away” is the old adage, and in fact significant tops have occurred in early April in each of the last 3 years. In each of those years, Fed stimulus was wearing off and the economy slumped. Last week’s Employment Report combined with the pending impact of tax increases and spending cuts plus renewed weakness in Europe suggest a repeat. In addition, corporate earnings have been declining for the past year and estimates and guidance for this year are coming down. To make matters worse, bullish sentiment toward stocks (particularly the ones that pay higher dividends) is at nose-bleed levels.
Investors About to Punt
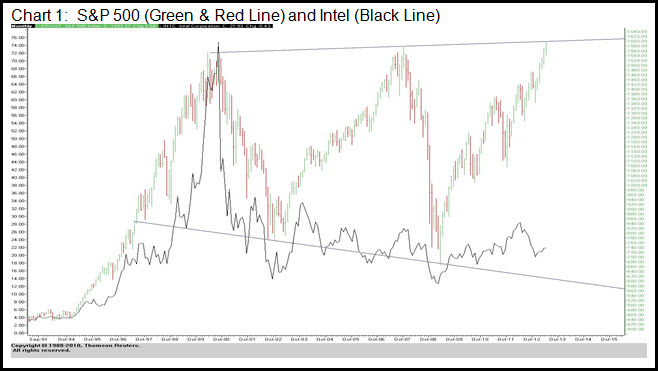
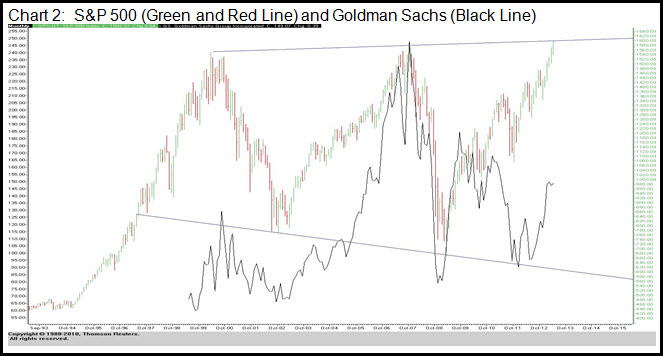
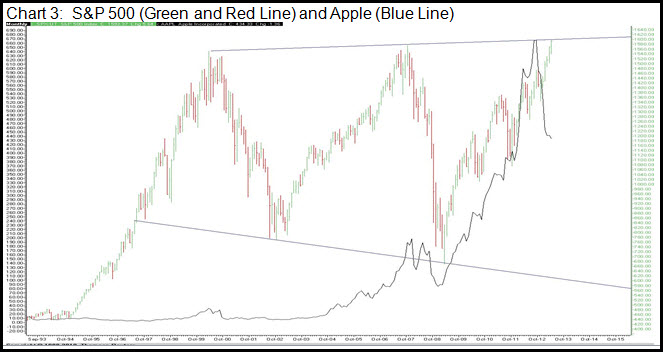
In addition to the intermediate risks to the economy and the stock market, there are significant cyclical or longer term risks as well. In fact, based on current levels of sentiment and valuation, we may be facing the third stock market bubble since the peak in 2000. We are all aware that since 1997, the S&P500 has been a meat grinder, alternately rallying and crashing between about 750 and 1500. In retrospect, the wild swings were justified, but to quote another Wall Street adage, “the financial memory is short”. Like Charlie Brown and Lucy, investors are once again setting up to punt. The important question today is: Are we finally achieving escape velocity? Is the “virtuous cycle” returning? The biggest delusion about opting for dividend paying stocks is that investors are being coaxed into the notion that Lucy won’t pull the ball away this time. After all, who would go for a 3% dividend yield on McDonald’s if the stock price was about to be cut in half again? So I am introducing 3 new charts that reflect the state of the market at the last 2 bubble peaks and what we have today. The purpose of the exercise is to illustrate how the current risks are just different enough from the last 2 lousy times to be bullish to convince the crowd that “This time is different”. In addition, notice that by getting to 1600 on the S&P500, the market has reached the “broadening top” target established by the peaks in 2000 and 2007. It really puts the enthusiasm at new highs into perspective.


At the first bubble peak in 2000 (see Chart 1), it was the technology stocks that reflected the new era, in that those with a handle on the leading edge of information and telecommunications technology were creating enormous wealth.
At the bubble peak in 2007 (see Chart 2), everyone was going to be rich because the juggernaut of the US housing market was a linear wealth builder and once again, no one had to lift a finger! And all the financial companies like (Merrill Lynch and Countywide-oops) Goldman Sachs could mint money financing the expansive consumer.
No Clear Leadership
Here at the current visit to 1500 on the S&P500 (see Chart 3), it is nearly impossible to identify some glorious economic driver. The fact that there is no clear leadership theme is likely to make it much more difficult for both fundamental and technical analysts to identify the top, once it occurs. Apple Computer was the poster child for the bull market from the 2009 trough, and perhaps other consumer discretionary names like Netflix, Chipotle and Amazon should be included, but did they ever capture the “new era” imagination of the public? Did they create a broad perception of economic prosperity? And more importantly, why did Apple stop going up in September and drop by 40% in 6 months if the bull market is just getting started?
The answer is that this latest bull market is courtesy of the Fed. First of all, they have stated that they want stock and real estate prices to rise, causing a “wealth effect” that will propel the economy to a self-sustaining growth trajectory. Second, there is a widely held belief that the Fed will come to the rescue with additional support if the market or the economy starts to slide. That is not quite as convincing as the magic of the internet or the linear uptrend in housing prices, but apparently it will suffice. We are left with trying to figure out when Mother Nature will trash this particular illusion.
All Eyes on Japan
I have underestimated the extent to which bubbles can inflate enough times to be truly humble, but there is something happening right now that really bears watching as a harbinger of change. During this last Fed-driven cyclical bull market, every announcement of a higher level of stimulus kept the party going. In fact, the decline that ended in June 2012 was attributable to the European Central Bank promising to “do whatever it takes”. And in Italian, no less! The decline that occurred after the election was brought to a halt by the Fed returning to the table with “QE Infinity”. In the last few days, Japan has entered the fray with a Kamikaze QE that is almost as big as the Fed announced last fall: $76 billion per month of liquidity injections into the global financial markets (the Fed is doing $85 billion). Japan is not that big a country. In the past, almost all the stock markets around the world responded bullishly to central bank intervention. If the Japanese effort doesn’t catch fire, it could be an indication that central bank liquidity injections are no longer synonymous with creating demand for financial assets.
In the meantime, the current level of valuation in the stock market is based on the hope that the Fed will succeed, not earnings momentum or an encouraging global economic reality so there is potentially a lot of air underneath it.
Does the latest backup in interest rates signal a slippery slope for investors in the long end of the bond market? I think not. The 30 year Treasury bond yield bottomed in July at 2.46% and rose all the way to 3.28% a few weeks ago, but it has already gotten half of it back. The yield on long-term closed end Municipal Bond Funds have been turned around again in the low 6% area and they seem to be very cheap compared to 0.50% CD rates. In the absence of a durable, self-sustaining expansion in the economy, rates should be headed lower and bond prices should be headed higher, extending the trend that began in 1981 a bit longer.
- English (UK)
- English (India)
- English (Canada)
- English (Australia)
- English (South Africa)
- English (Philippines)
- English (Nigeria)
- Deutsch
- Español (España)
- Español (México)
- Français
- Italiano
- Nederlands
- Português (Portugal)
- Polski
- Português (Brasil)
- Русский
- Türkçe
- العربية
- Ελληνικά
- Svenska
- Suomi
- עברית
- 日本語
- 한국어
- 简体中文
- 繁體中文
- Bahasa Indonesia
- Bahasa Melayu
- ไทย
- Tiếng Việt
- हिंदी
A Bubble In The Bond Market?
Latest comments
Loading next article…
Install Our App
Risk Disclosure: Trading in financial instruments and/or cryptocurrencies involves high risks including the risk of losing some, or all, of your investment amount, and may not be suitable for all investors. Prices of cryptocurrencies are extremely volatile and may be affected by external factors such as financial, regulatory or political events. Trading on margin increases the financial risks.
Before deciding to trade in financial instrument or cryptocurrencies you should be fully informed of the risks and costs associated with trading the financial markets, carefully consider your investment objectives, level of experience, and risk appetite, and seek professional advice where needed.
Fusion Media would like to remind you that the data contained in this website is not necessarily real-time nor accurate. The data and prices on the website are not necessarily provided by any market or exchange, but may be provided by market makers, and so prices may not be accurate and may differ from the actual price at any given market, meaning prices are indicative and not appropriate for trading purposes. Fusion Media and any provider of the data contained in this website will not accept liability for any loss or damage as a result of your trading, or your reliance on the information contained within this website.
It is prohibited to use, store, reproduce, display, modify, transmit or distribute the data contained in this website without the explicit prior written permission of Fusion Media and/or the data provider. All intellectual property rights are reserved by the providers and/or the exchange providing the data contained in this website.
Fusion Media may be compensated by the advertisers that appear on the website, based on your interaction with the advertisements or advertisers.
© 2007-2025 - Fusion Media Limited. All Rights Reserved.
