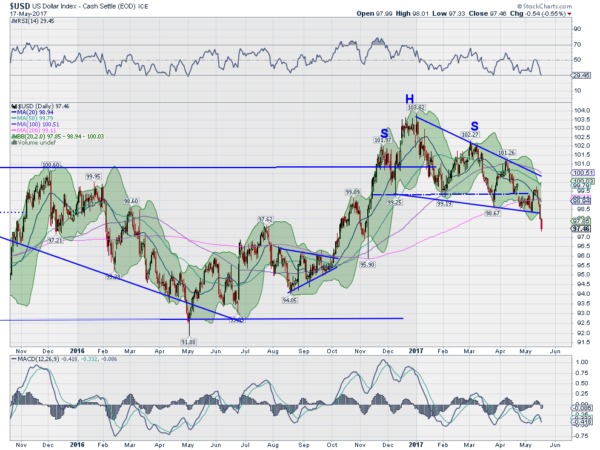
Wednesday morning I spoke on Benzinga’s pre-market show about a breakdown in the US Dollar, among other things. Let’s delve deeper into that here. Where the US Stock market has been flying, the US Dollar gave up that adjective at the beginning of the year. The US Dollar Index made a high in January 3rd. Since then it has made a series of lower lows and lower highs, the definition of a downtrend.
But the chart below shows two major patterns that were battling each other through this downtrend. The first was a Head and Shoulders top. It failed to breakdown on the first crack of the neckline but never passed above the right shoulder. this would have negated the pattern. Instead it reversed and continued lower through the neckline again. A retest held and it has reversed lower again. This leaves a price objective to at least 94.80.

The second is a Falling Wedge. This pattern is normally though to be a bullish pattern, digesting a previous move higher. A break to the upside would look to add nearly 5 points to the Index. But wedges and any consolidation can break in either direction. and that is what this wedge did, with a move lower in the US Dollar earlier this week.
The break of the wedge to the downside establishes a target of 93.80. Now there are two price targets to the downside from patterns that are aligned. And momentum is strongly bearish. The RSI is edging into oversold territory while the MACD is crossed down, negative and falling. It looks like more downside for the greenback for now.
The information in this blog post represents my own opinions and does not contain a recommendation for any particular security or investment. I or my affiliates may hold positions or other interests in securities mentioned in the Blog, please see my Disclaimer page for my full disclaimer.
