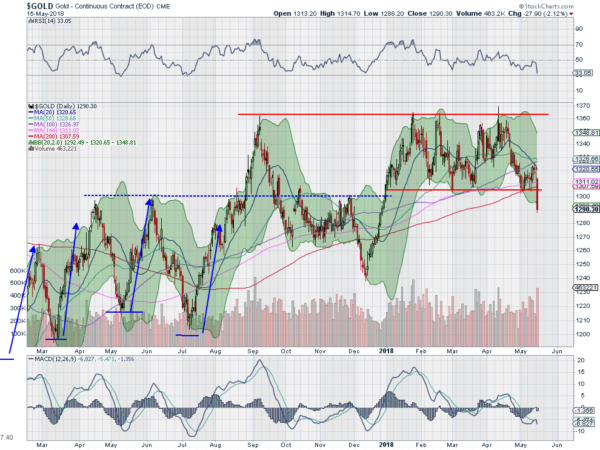
Gold had its ups and downs in 2017. It finished the year with a breakdown below its 200 day SMA in early December and then a quick recovery to end December positive. The promise of further price increases led into January, and it made a higher high to start the year. That move up continued until the end of the month when it reached the September 2017 high. It met resistance there and dropped back. This established the range for the year, 1310 on the downside and 1365 on the upside. It moved back and forth in this range for 4 1/2 months. Boring. That is until Tuesday.
The chart below shows Gold breaking the range to the downside Tuesday. Significantly it also broke below its 200 day SMA and the important psychological level of 1300. In the early hours Wednesday morning there has not been a bounce or recovery. Does this mean more downside to come? There are many indications in that chart that suggest the answer is yes.
First is the way that it broke down. A strong move lower with a candlestick that shows selling continuing all day and ending near the low of the day. Next there is momentum dropping toward oversold levels, deep in bearish territory, but not oversold yet. And there are the Bollinger Bands starting to turn down. All of these indicators support a continued move lower. And chart patterns suggest it could drop as low as 1270 before finding initial support and retest the December low at 1240 if that does not hold.
The information in this blog post represents my own opinions and does not contain a recommendation for any particular security or investment. I or my affiliates may hold positions or other interests in securities mentioned in the Blog, please see my Disclaimer page for my full disclaimer.

