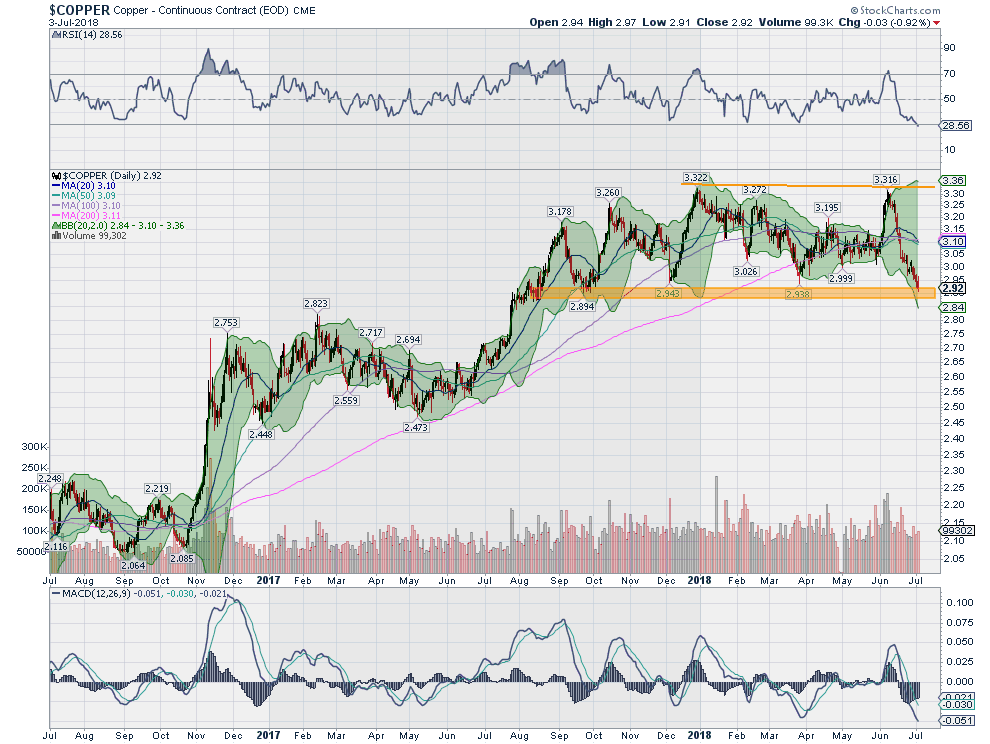
Remember when inflation fears were a thing? Commodity prices were rising and we were debating whether the FOMC would raise rates 3 or 4 times in 2018? That was fun wasn’t it? Copper prices had moved higher in late 2016 and then settled in for the first half of 2017. in July 2017 they started to move higher again. They made a series of higher highs into the end of 2017, buffeted by support below. The 200 day SMA rose to meet price in April of 2018 and that raised the support level.
In June the price of Copper started to move higher again, and was quickly testing the highs made at the end of 2017. The fast rise and momentum behind it reignited the inflation fears. But it has a short lived experience. As quickly as Copper prices rose, they started to move back lower again. Now they are back testing the support of the lows from 2017.

As this happens there are many indications that this may be the start of a bigger price decline. The price is now well below the 200 day SMA. And the 50 day SMA has crossed down through the 200 day SMA, a Death Cross. These are bearish signs. Momentum is also bearish. The RSI is venturing into oversold territory, but not by much, while the MACD negative and driving lower. The Bollinger Bands have also opened to the downside allowing the price to continue lower. A break of the support zone could see a quick drop to $2.75 or even the prior support at $2.50.
The information in this blog post represents my own opinions and does not contain a recommendation for any particular security or investment. I or my affiliates may hold positions or other interests in securities mentioned in the Blog, please see my Disclaimer page for my full disclaimer.
