In a recent article I highlighted some stocks that appeared to have a chance of “putting in a low”. In another article, I highlighted the potential usefulness of “horizontal lines” on a chart. The phrase “putting in a low” is essentially a kinder, gentler version of the phrase “Hey, let’s pick a bottom.”
The reality is that the ability to “pick tops and/or bottoms” on any kind of a consistent basis is a skill that roughly 99.2% of all investors and traders do not possess. That being said, there is such a thing as a legitimate “bottom formation” (at least in my market addled opinion). A security that bounces several or more times off a particular price is sending information that the sellers may be running out of ammunition. These levels can be observed by drawing horizontal trend lines across a price chart – connecting recent highs and/or lows at roughly similar prices.
“Loading up” in this situation is not recommended. But committing an acceptable percentage of one’s portfolio (a level which each investor must decide on their own) to such opportunities is a perfectly acceptable form of speculation.
So for arguments sake, below is a “Bottom Pickers Portfolio”. As always, I am not recommending this as an investment, simply highlighting an alternative idea for your further consideration.
The Tickers
The tickers included in this portfolio are mostly all commodity related. That is not a purposeful choice; they simply “fit the model”.
First is ticker BAL – an ETF that tracks the price of cotton futures. The critical level for BAL is roughly the $43.50 area.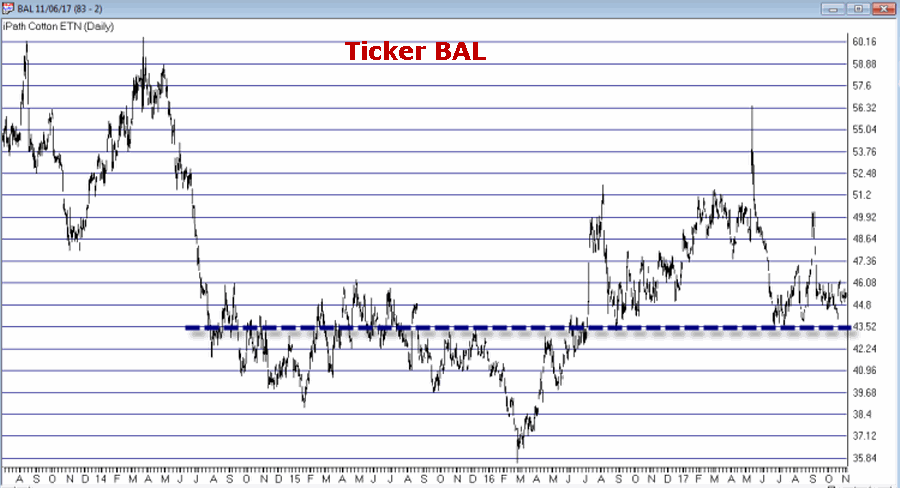
Figure 1: Courtesy AIQ TradingExpert
Ticker GDX tracks a gold stock index and has been consolidating in a relatively tight range after last year’s sharp rally and subsequent pullback.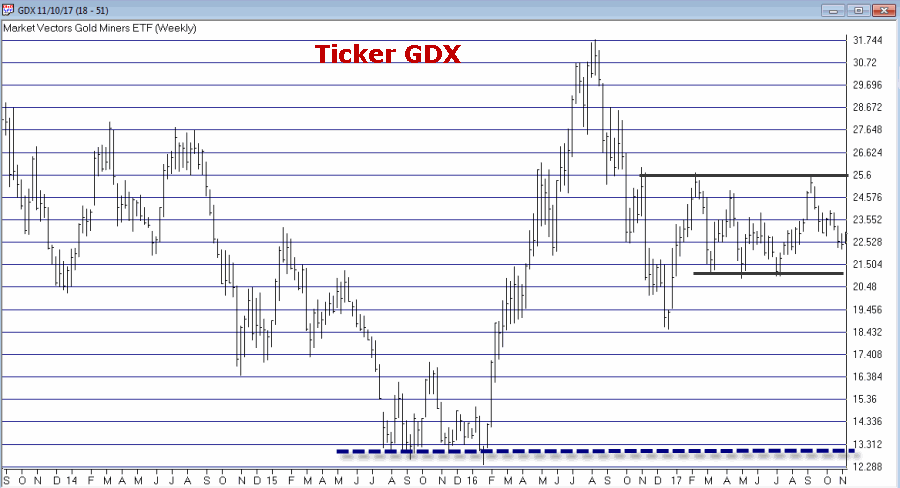
Figure 2: Courtesy AIQ TradingExpert
Ticker JO tracks the price of coffee futures. This is one of the weakest charts on the list and is dangerously close to failing to the downside. However, if the low holds this will strengthen the outlook a great deal.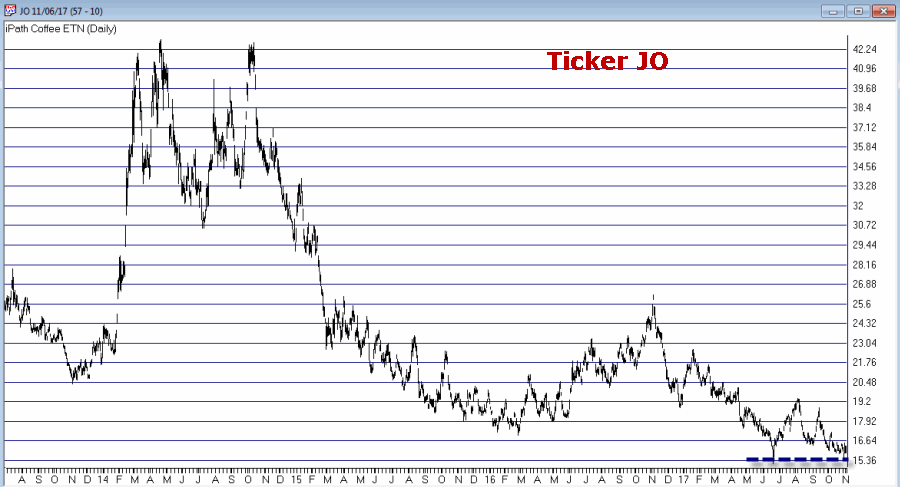
Figure 3: Courtesy AIQ TradingExpert
Ticker SGG tracks the price of sugar futures. SGG has been consolidating in a narrow range for about four months. Key price levels on the downside are $26.50 and the August 2015 low of $24.79.
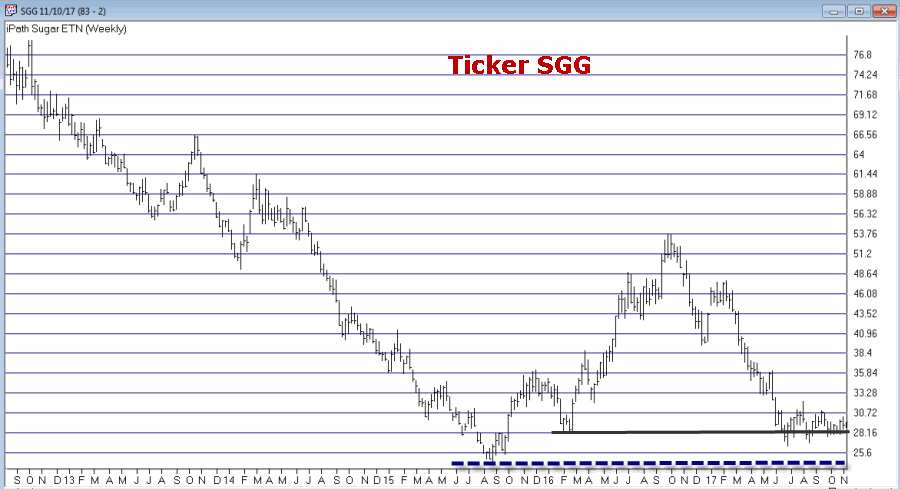
Figure 4: Courtesy AIQ TradingExpert
Ticker SWN is Southwestern Energy Co. After a long, devastating decline the stock is attempting to form a low in the $5 a share range.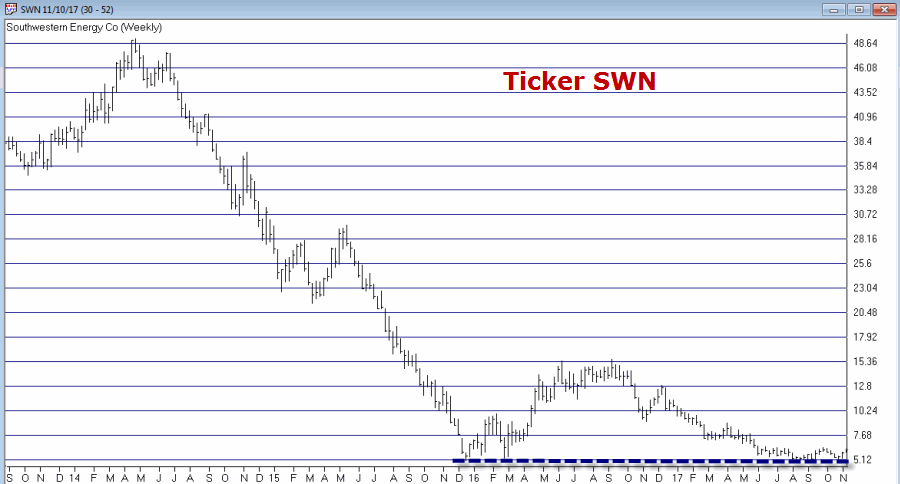
Figure 5: Courtesy AIQ TradingExpert
Ticker UNG tracks natural gas futures. Thanks to the advent of fracking – which is made natural gas abundantly available – the price of natural gas has collapsed in recent years. In the past week it retested its 2016 low and then ticked higher. Like JO, this one is precariously close to “failing”. But for now…
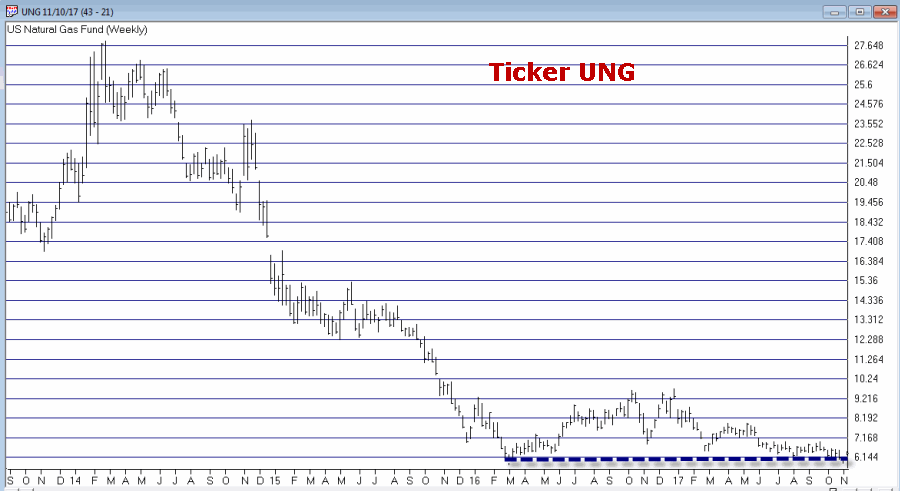
Figure 6: Courtesy AIQ TradingExpert
Bottom Pickers Portfolio
I use AIQ TradingExpert software to create my own “Groups.” So I created one called “Lows” to include the six tickers above. The group consists of an equal dollar investment in each ticker. The chart for this combination of tickers appears in Figure 7.
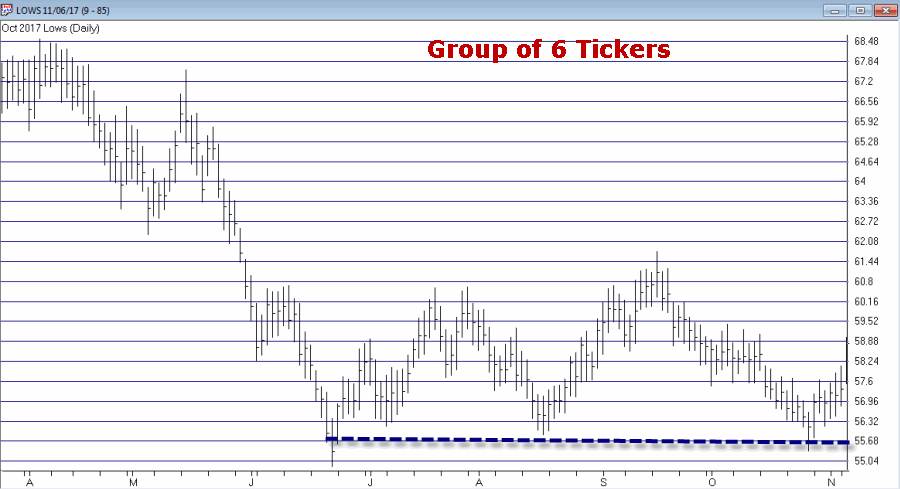
Figure 7: Courtesy AIQ TradingExpert
Summary
Let me be blunt. There is every chance that the majority of the tickers highlighted above will continue their long-term bearish trends and break down to the downside causing further losses for those holding these shares.
The primary thing to highlight in this piece is a personal preference. I prefer “horizontal” lines on a chart – i.e., straight across, left to right – to the more typical slanted trend lines that most traders use. The reason is simply – upward or downward slanting trend lines require a trader to decide which two (or more) highs (or lows) to connect in order to draw the trend line. At the end of the day this is often a subjective decision.
Horizontal trend lines – which connect to (at least roughly equal) highs or lows – are generated by the market itself and as such, are more objective in nature. In other words, investor buying and selling determines these levels.
Will my “Bottom Pickers Portfolio” move to the upside or fail to the downside? We’ll just have to wait to find out.
