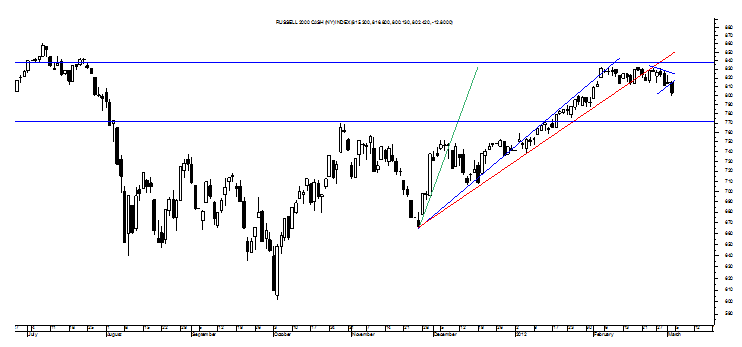
As early as February 9, the strange sideways consolidation showing in the Russell 2000 was discussed here and then dissected as the congestion turned into a Double Top and then into a Symmetrical Triangle last week into early this week.
That last pattern began to confirm to the downside earlier this week only to create the Symmetrical Triangle marked in last night that did rather well for itself today as shown above with the pattern confirmed to the downside for its target of 790. Perhaps more important, though, is the fact that the Russell 2000 is undeniably below its third Bear Fan Line in red and this signals a reversal of the index’s near-term uptrend and it was this sideways trading that was noted as a reason to think the risk rally could be at risk in Tuesday night’s A Breakout, Holdbacks and the RUT. Summed up, the RUT seems to be stuck in a rut and it may not bode so well for risk.
Equally worth noting is that when its recent trading is viewed in the context of the sideways trend that held it captive for much of the first half of last year, record highs and all, perhaps the greater significance of a possible drop down to 790 is the likelihood of the Russell 2000 dropping down toward the bottom of that range near 771.
In turn, this potential 4% decline for small cap may signal a 5-10% decline for the other indices that have been somewhat shielded by AAPL with the Dow showing some disguised sideways weakness similar to what’s taking place in the RUT, 13000 and all, and perhaps for the lack of that protection too.
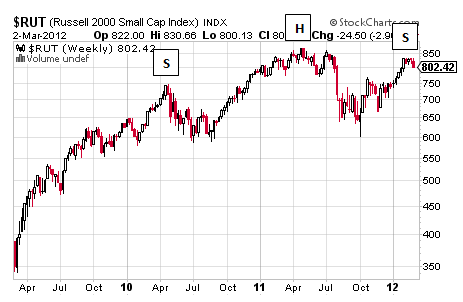
The bigger problem with the Russell 2000’s recent downturn, though, is showing in the seeming right shoulder it creates for a multi-year Head and Shoulders pattern and one that was detailed in February 10’s Recession, Depression or Recovery?
At that time, the pattern was more about projection whereas at this time, there’s still some projection involved, but there’s a good bit of reality as can be seen in the weekly chart on the following page.
This pattern is absurd like AAPL’s Rising Wedge along with all of the other extreme bear patterns showing in charts everywhere that call for 50%+ declines and to a degree that it may actually start to make sense to begin thinking about that kind of decline happening for real. It may be early, but now is the time to think about it, not when it happens at some point later this year or in 2014 if it is reinflated into the future.
Be that as it may, there’s no question that the Russell 2000 is showing the structure of a classic Head and Shoulders pattern and it is similar to the pattern showing, funny enough, in basic materials, copper and many other market segments that are seemingly unrelated to small cap.
What relates all of these charts, of course, is the disgusting greed and consumerism made possible by supply side economics, perhaps, that was so outrageous that it actually hit the impossibility of the infinite slope in the near-collapse of the system in 2008 and a collapse that is still coming but just in slow-motion waves unless the Fed manages to defy and redirect physics as it may.
Anyhow, the fact that the Russell 2000 is now showing a good skeleton for a beautiful Head and Shoulders that will try to take the index down to 350 and right around the level that confirms a truly massive Double Top also detailed in Recession, Depression or Recovery? may lend some reason to believe that 2012 will be a repeat of 2011 but with a possibly more corrective correction.
Should this prove true, one of the first truly strong technical signs of it is showing in a big H&S in small cap.
- English (UK)
- English (India)
- English (Canada)
- English (Australia)
- English (South Africa)
- English (Philippines)
- English (Nigeria)
- Deutsch
- Español (España)
- Español (México)
- Français
- Italiano
- Nederlands
- Português (Portugal)
- Polski
- Português (Brasil)
- Русский
- Türkçe
- العربية
- Ελληνικά
- Svenska
- Suomi
- עברית
- 日本語
- 한국어
- 简体中文
- 繁體中文
- Bahasa Indonesia
- Bahasa Melayu
- ไทย
- Tiếng Việt
- हिंदी
A Big H&S In Small Cap
Latest comments
Loading next article…
Install Our App
Risk Disclosure: Trading in financial instruments and/or cryptocurrencies involves high risks including the risk of losing some, or all, of your investment amount, and may not be suitable for all investors. Prices of cryptocurrencies are extremely volatile and may be affected by external factors such as financial, regulatory or political events. Trading on margin increases the financial risks.
Before deciding to trade in financial instrument or cryptocurrencies you should be fully informed of the risks and costs associated with trading the financial markets, carefully consider your investment objectives, level of experience, and risk appetite, and seek professional advice where needed.
Fusion Media would like to remind you that the data contained in this website is not necessarily real-time nor accurate. The data and prices on the website are not necessarily provided by any market or exchange, but may be provided by market makers, and so prices may not be accurate and may differ from the actual price at any given market, meaning prices are indicative and not appropriate for trading purposes. Fusion Media and any provider of the data contained in this website will not accept liability for any loss or damage as a result of your trading, or your reliance on the information contained within this website.
It is prohibited to use, store, reproduce, display, modify, transmit or distribute the data contained in this website without the explicit prior written permission of Fusion Media and/or the data provider. All intellectual property rights are reserved by the providers and/or the exchange providing the data contained in this website.
Fusion Media may be compensated by the advertisers that appear on the website, based on your interaction with the advertisements or advertisers.
© 2007-2025 - Fusion Media Limited. All Rights Reserved.
