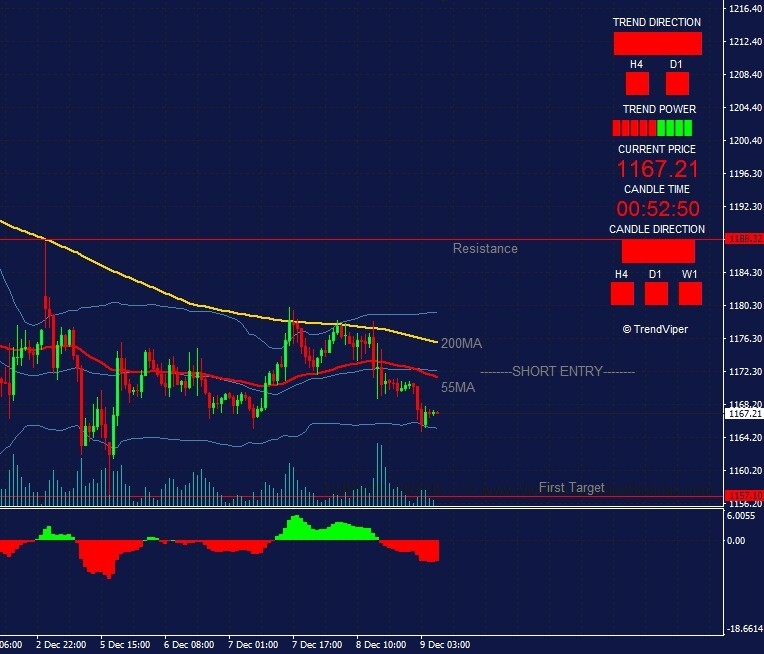
Gold has continued to trade in an uneventful season. The pair has especially dropped further this week to levels below $1117.00. For what was expected to be a seemingly quiet month for the metal, gold has shown more signs of struggle as other major currencies and oil continue to thrive.
The USD in particular showed great strength against the “safe commodity” as a strong jobs report was released this week. Traders are poised to take advantage of the current selloff, as it occurs at a rare time when the US treasury yields and the euro are also making declines. Gold spot opened at $1170 and dropped to 1167.80 just before the London open on Friday.
Technical levels on the gold spot (XAU/USD)
The current lows in gold prices were last seen in February 2016. The bears are heavily challenging to reach levels lower than that with the $1170 historic level now reached. The level is also the 5MA on the daily and just about the 55MA on the M15 chart.
We can count on lower levels like $1140 (Jan 2016) being challenged because of the strong bearish momentum on the larger time frames and fundamentally, the announcements that the 10-year US treasury yields have increased by 4.5 basis points. The $1200 psychological level will also be a major hurdle for the XAU/USD to break in case a slight recovery plays out in case of any profit taking stances.
Chart: Gold spot price on the one hour chart
Image source: Meta Trader 4 with trend indicator based on moving averages and ADX.
Trade ideas on the gold commodity
The 1188.32 is the nearest top for the interim and has so far been the highest price reached in December. The level is also directly on the 200MA on the H1 chart and the price seems to drop every time that MA is touched. The H1 200MA remains a formidable resistance zone for the XAU/USD and we can treat the sentiments as bullish for as long as the price fails to break above that level. Other indicators also show growing bearish action on medium term charts for spot gold. The growing bearish action is also a slight conviction that a bullish correction is still far from the picture.
The trend indicator based on MAs shows that the overall trend direction is bearish. We also have supporting indicators like the ADX showing very strong bearish continuation with candles on the higher charts also printing red (from a H1 viewpoint). A break below the lower Bollinger band® in the chart would be a further confirmation that the bears are going for the 1157.00 December low with more intent. For the moment, bear trades will have the 1157 as the first target over the next few days of trading.

