In my periodic Treasury update, I focus primarily on the 10-year yield and include a look at the 30-year fixed mortgage rate. The 10-year Treasury Note has been around for a long time. The FRED database includes monthly data for the 10-Year Treasury Constant Maturity Rate going back to April of 1953. Yale professor (and Nobel Laureate) Robert Shiller's university website includes an Excel file with the monthly 10-year yield going all the way back to 1871.
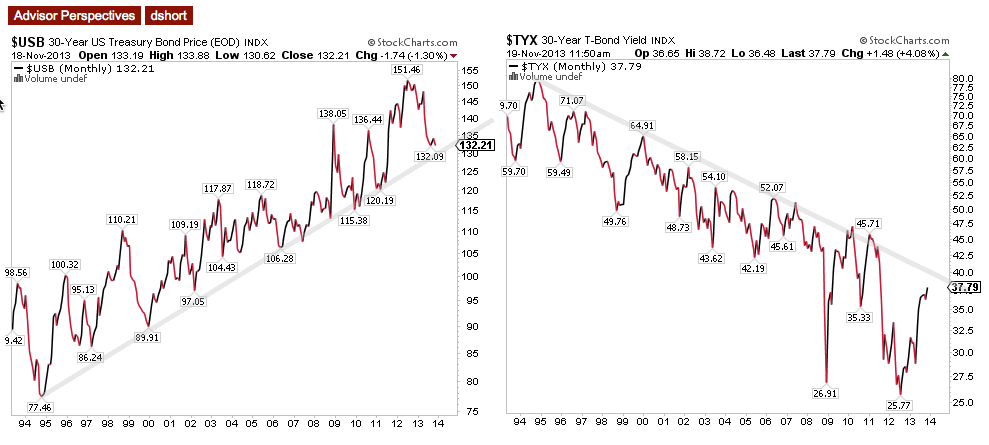
What about the 30-year Treasury? Earlier this week I received an email from Floyd Flanagan featuring an interesting pair of monthly charts, courtesy of Stockcharts.com, for the 30-year Treasury Bond going back 20 years. The left side below shows the 30-year price index, the right side the yield. Floyd has annotated the two with support and resistance.
Floyd included this comment:
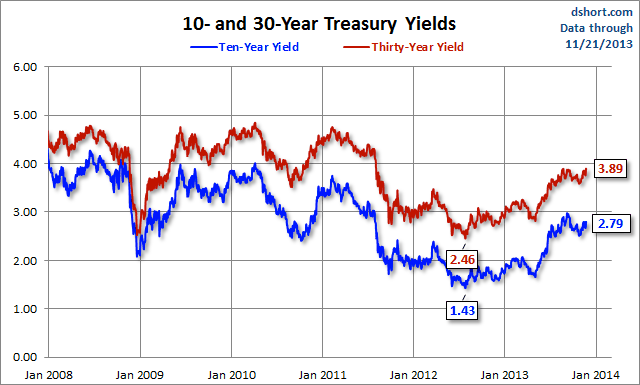
Here is a closer look at the 10- and 30-year daily closing yields since the onset of the Financial Crisis. Both hit historic lows in July of 2012. Subsequently the 10-year hit an interim closing high of 2.98% on September 5th. The 10-year hit an interim high of 3.90% ten sessions earlier and matched that high this past Wednesday, dropping one bp at yesterday's close. The 10-year closed yesterday 19 bps below its interim high.
These will be interesting to watch in the days and weeks ahead.
- English (UK)
- English (India)
- English (Canada)
- English (Australia)
- English (South Africa)
- English (Philippines)
- English (Nigeria)
- Deutsch
- Español (España)
- Español (México)
- Français
- Italiano
- Nederlands
- Português (Portugal)
- Polski
- Português (Brasil)
- Русский
- Türkçe
- العربية
- Ελληνικά
- Svenska
- Suomi
- עברית
- 日本語
- 한국어
- 简体中文
- 繁體中文
- Bahasa Indonesia
- Bahasa Melayu
- ไทย
- Tiếng Việt
- हिंदी
A 20-Year Look At The 30-Year Treasury Bond
Latest comments
Loading next article…
Install Our App
Risk Disclosure: Trading in financial instruments and/or cryptocurrencies involves high risks including the risk of losing some, or all, of your investment amount, and may not be suitable for all investors. Prices of cryptocurrencies are extremely volatile and may be affected by external factors such as financial, regulatory or political events. Trading on margin increases the financial risks.
Before deciding to trade in financial instrument or cryptocurrencies you should be fully informed of the risks and costs associated with trading the financial markets, carefully consider your investment objectives, level of experience, and risk appetite, and seek professional advice where needed.
Fusion Media would like to remind you that the data contained in this website is not necessarily real-time nor accurate. The data and prices on the website are not necessarily provided by any market or exchange, but may be provided by market makers, and so prices may not be accurate and may differ from the actual price at any given market, meaning prices are indicative and not appropriate for trading purposes. Fusion Media and any provider of the data contained in this website will not accept liability for any loss or damage as a result of your trading, or your reliance on the information contained within this website.
It is prohibited to use, store, reproduce, display, modify, transmit or distribute the data contained in this website without the explicit prior written permission of Fusion Media and/or the data provider. All intellectual property rights are reserved by the providers and/or the exchange providing the data contained in this website.
Fusion Media may be compensated by the advertisers that appear on the website, based on your interaction with the advertisements or advertisers.
© 2007-2025 - Fusion Media Limited. All Rights Reserved.
