Bullish developments abound for USD/CAD, explaining why the pair is the day’s strongest major cross. There are at least nine major developments supporting the surge:
- Friday’s Q4 GDP release out of Canada came in well below expectations at just 0.4% annualized vs. 1.0% expected. The data was errantly released early on Statistics Canada’s website, giving some traders an early jump on the release and contributing to general bearish loonie sentiment.
- Shortly thereafter, Markit revealed a slight miss in the February manufacturing PMI data (52.6 vs. 53.0 eyed), confirming that the Q4 slowdown has carried over into Q1 of this year.
- The price of oil, Canada’s most important export, is dropping sharply, with WTI shedding nearly 2.5% as of writing.
- On the US dollar side of the ledger, William Dudley, the influential former head of the New York Federal Reserve, suggested that the Fed may still resume raising interest rates later this year. As noted on twitter, traders are not remotely prepared for such a hawkish shift.
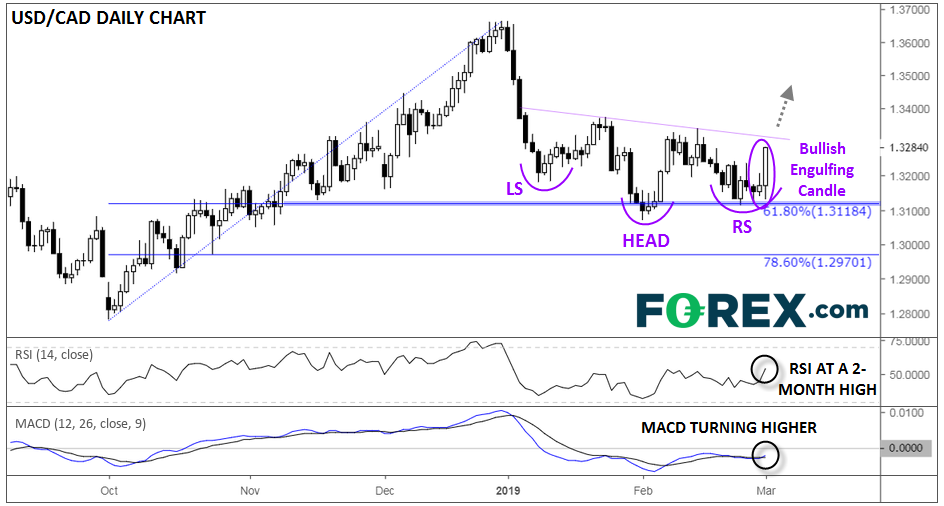
- Turning our attention to the chart, USD/CAD found support at the 61.8% Fibonacci retracement of its Q4 rally...
- …and it’s now showing a big “bullish engulfing” signal, signaling a shift to strong buying pressure…
- …while the pair is also showing a potential inverted “head and shoulders,” a longer-term bullish reversal pattern.
- Meanwhile, the MACD indicator is turning higher to cross above its signal line…
- …and the RSI is at its highest level in two months. Both developments suggest a shift in favor of the bulls under the surface.
Moving forward, a break above the neckline of the inverted head-and-shoulders pattern around 1.3300 would open the door for continued gains toward 1.3400 or 1.3500 in the coming weeks.

Source: TradingView, FOREX.com
Cheers
