Investing.com’s stocks of the week
Pre-Open Market Analysis
Yesterday rallied strongly and broke above last week’s high. The Emini is now testing the 200-day moving average, which has been resistance for several months.
The bulls want the rally to break above the October-December triple top. While it might, there will probably be at least a 2 – 3 week pullback 1st.
This is now the 8th consecutive week with a bull body on the weekly chart. This is the 1st it has happened in 6 years. Since it is extremely rare, the odds are that this week or next week will have a bear body. A reversal down from here would form an expanding triangle top on the 60-minute chart.
After an 8 bar bull micro channel, the bulls will be eager to buy the 1st 1 – 3 week pullback. Consequently, the downside risk is small in February.
Overnight Emini Globex Trading
The Emini is up 6 points in the Globex session. It is at the resistance of the 200-day EMA. In addition, this is the 3rd bull bar in 5 weeks on the weekly chart. Therefore, this rally is a small parabolic wedge buy climax at resistance. The odds favor at least a 1 – 3 week pullback beginning within a week. Consequently, there is an increased chance of bear trend days for a couple weeks.
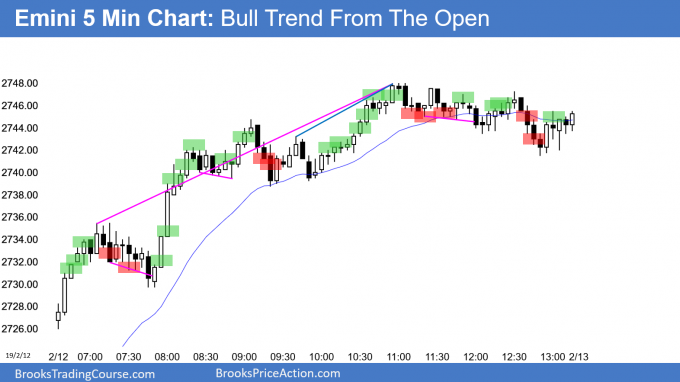
Yesterday ended with a trading range in a bull trend on the 5-minute chart. Since there is a possible wedge top and expanding triangle top on the 60-minute chart, yesterday’s trading range might be the final bull flag. As a result, traders will look for a reversal down today.
Can today be another big bull trend day? Not likely. There is a parabolic wedge buy climax and an unsustainable streak of 8 bull bars on the weekly chart. Also, it is at the resistance of the 200-day moving average. Finally, the 60-minute chart might form a top today or tomorrow. These factors reduce the chance of a big bull day today.
Yesterday’s Setups

Here are several reasonable stop entry setups from yesterday. I show each buy entry with a green rectangle and each sell entry with a red rectangle. I rarely also show limit order entries and entries on the close of bars. My goal with these charts is to present an Always In perspective. If a trader was trying to be Always In or nearly Always In a position all day, and he was not currently in the market, these entries would be logical times for him to enter.
