The Australian dollar has not had the best week, despite markets originally perceiving RBA’s monetary policy meeting as slightly hawkish. GDP was softer than expected, primarily weighed down by dire personal consumption before their trade surplus narrowed to the point of nearly vanishing. Taking the negative US-AU yield spread into account, firmer greenback and pending NFP report, AUD/USD could have found itself below 75c had it not been for strong Chinese trade data today.
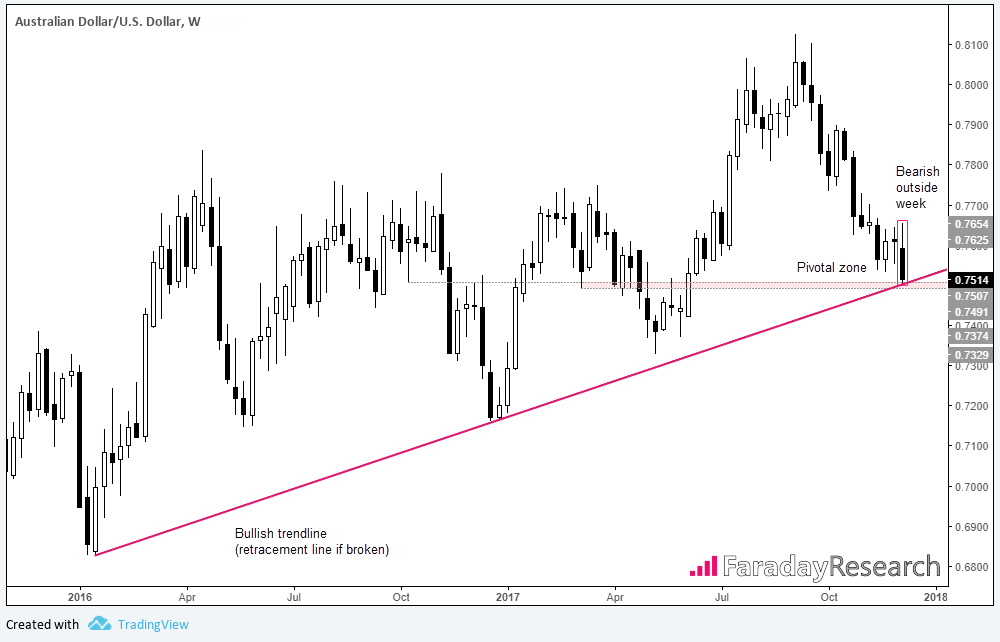
We deem the 75c area to be of significance as it marks a pivotal area which could provide bullish or bearish setups further out. Yet whilst 75c is a convenient round number, we mark the actual zone of support to sit between 0.7941 and 0.7503, which comprises of the March 17 lows and bullish trendline from the 2016 low. Such pivotal areas have a tendency to tempt profit taking and take the sting out of a move, yet with the market spending most of the session at the lows, there doesn’t appear to be a queue of buyers at time of writing.
The weekly chart has so far respected the bullish trendline from the 2016 lows, although this week’s bearish outside candle seemingly has another idea. As compelling as 75c may appear as potential support for some, a break of this key juncture will look equally (if not more) tantalising to bears. That said, it ain’t broken ‘til it’s broken, so whilst price action remains above the trendline there is potential for a bounce higher.
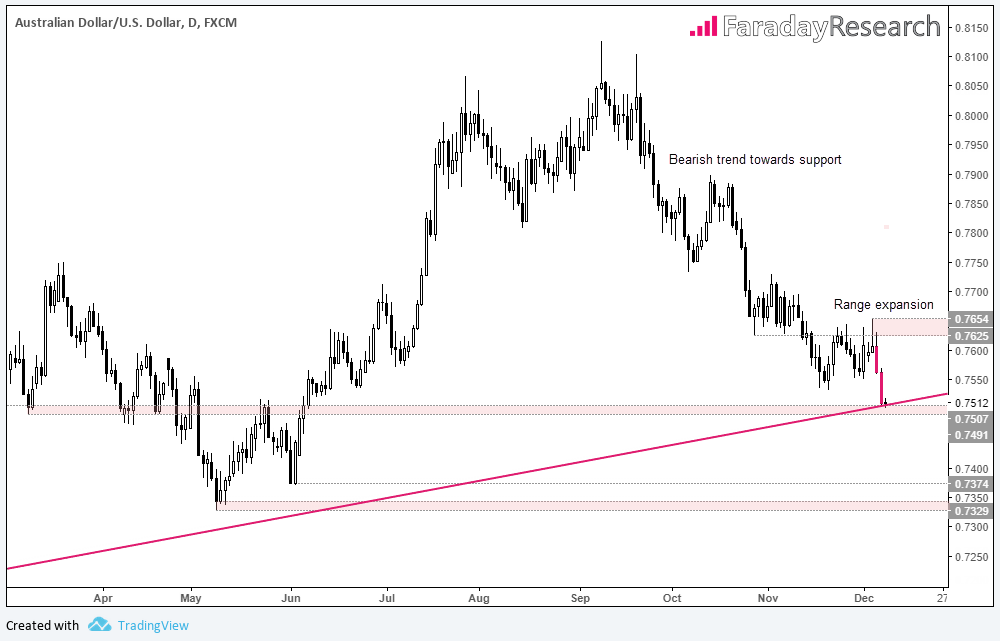
The daily timeframe shows a strong bearish trend which has accelerated towards 75c support. Moreover, the two days of bearish range expansion suggest bears could be serious above taking this to new lows. How prices react around current prices are key going forward but, due to the dominant bearish momentum, our bias is to the short side if certain conditions are met.
First, we would want to see the support zone decisively broken before seeking evidence of price compression. Simply entering short after range expansion leaves us vulnerable to entering nearer the end of an exhausted move. If a break occurs, we’d then patiently seek a low volatility pullback, series of narrow-ranged candles or bearish continuation patterns to suggest the market has pause for breath. If we then see momentum return on a lower timeframe, we’d be interested.
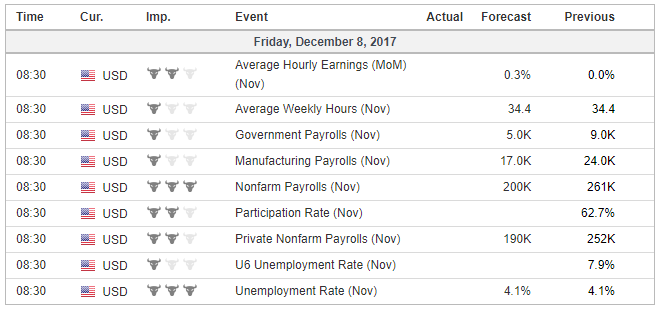
With Australian data over for the week, it’s today’s NFP report which could be the deciding factor in which side of 75c AUD close the week. After NFP, the main event of next week is the final Fed meeting of 2017. As a hike is widely expected and therefore likely priced in, the FOMC meeting could throw AUD/USD a lifeline and send it comfortably above 75c. This is another good reason to wait for a decisive break before committing.


