S&P 500
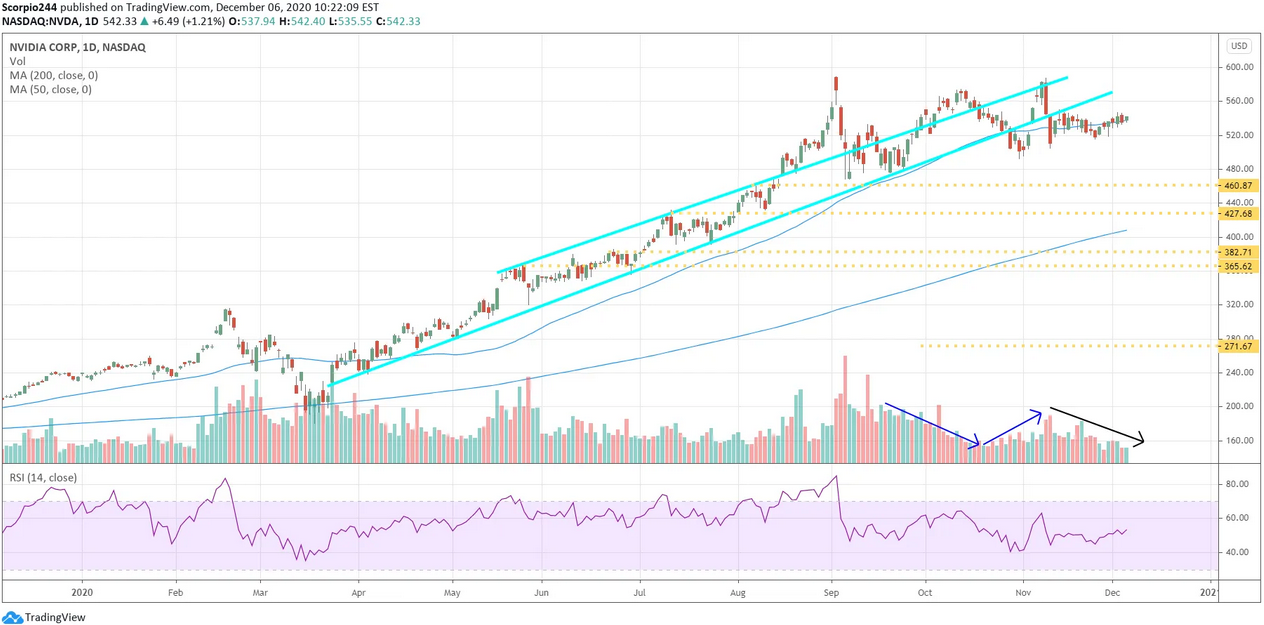
Stocks continued to rally this past week, closing just below the 3,710 target level. While it feels like the full bull mode is upon us with a seasonally strong time of the year, many things suggest the rally is overextended. It doesn’t mean it is about to end today, but typically these things end sooner than expected and without notice. It likely means this is a time we should be thinking about de-risking.
There is what appears to a rising triangle counted out, along with an RSI that has hit just about the overbought level at 70.
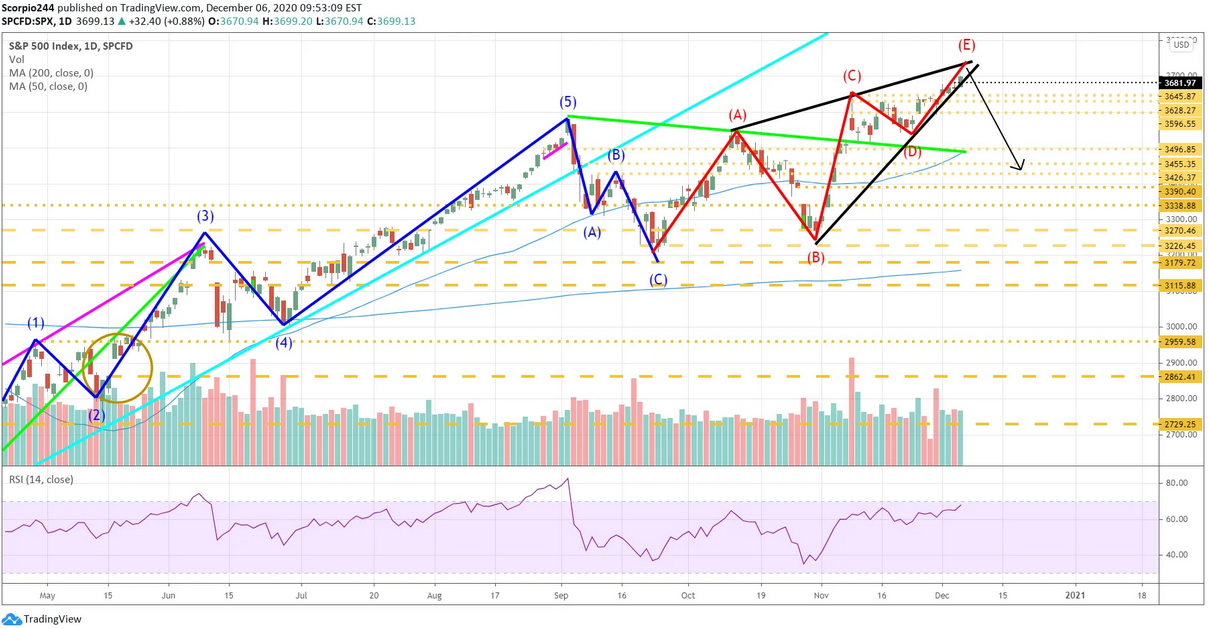
A larger version of the same pattern is also visible in the S&P 500 futures, with an RSI near overbought and volume levels diminishing rapidly, along with 5 of 5 wave count. Again, suggesting a topping pattern and the potential for a big reversal.
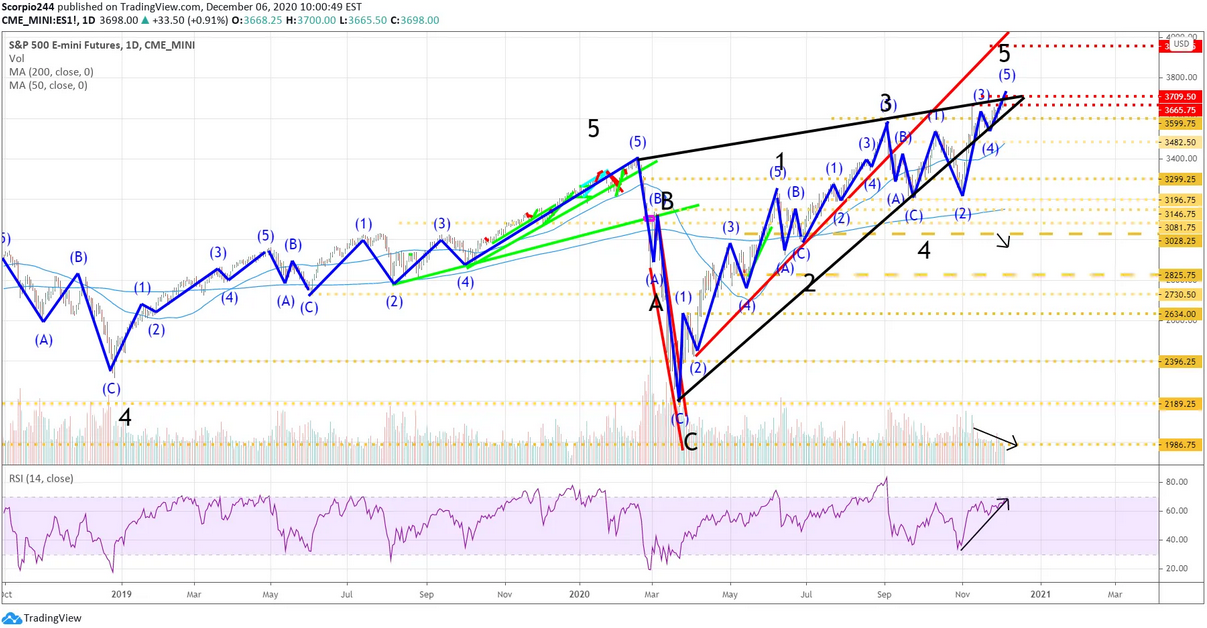
Meanwhile, last week we the most shorted stock continue to lead all of the major indexes higher. Probably not the group that should be outperforming.
AMD And Xilinx
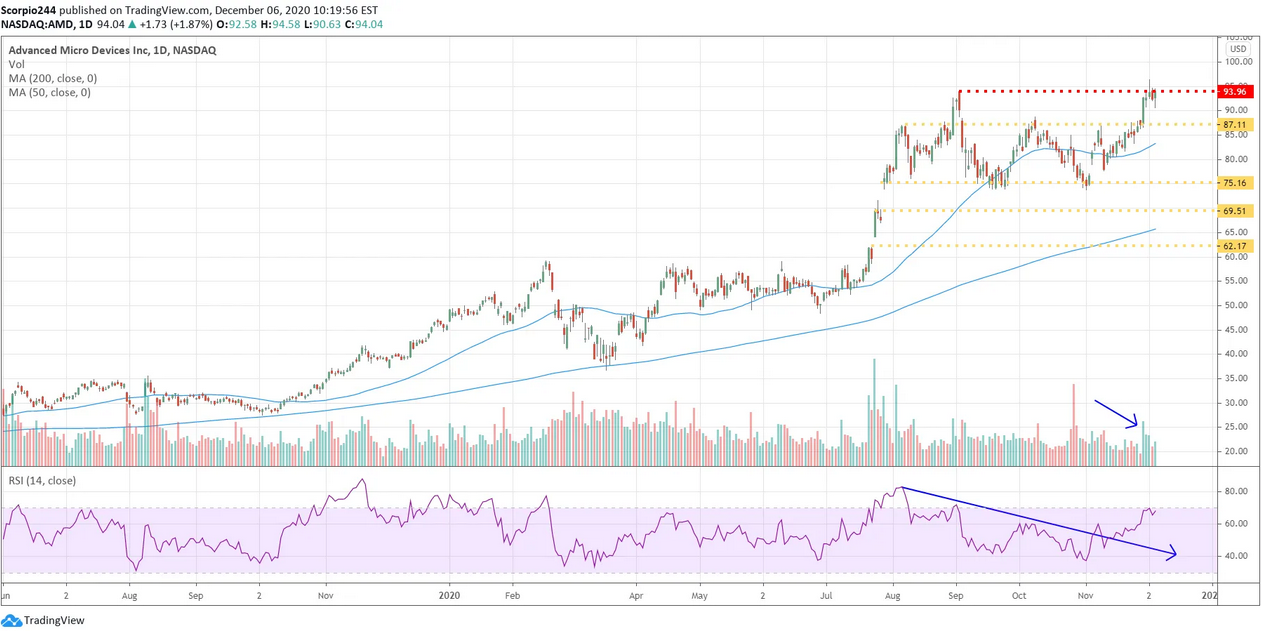
It’s not the best sign for the AMD bulls that the stock is struggling to break out at resistance with an RSI that is around overbought levels. My view hasn’t changed, which is that Xilinx’s weight will keep a lid on this stock, and AMD will get dragged lower towards $75, which will in-turn drag Xilinix down.
Nvidia
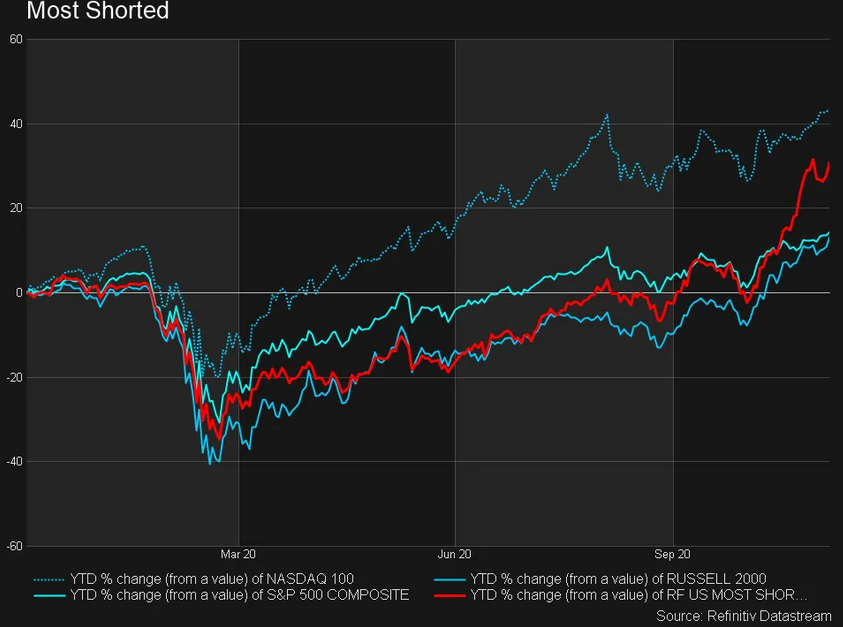
Nvidia (NASDAQ:NVDA) hasn’t participated one bit in the SMH rally and has many of those same negative qualities as the broader markets. I still contend the stock falls to around $460.
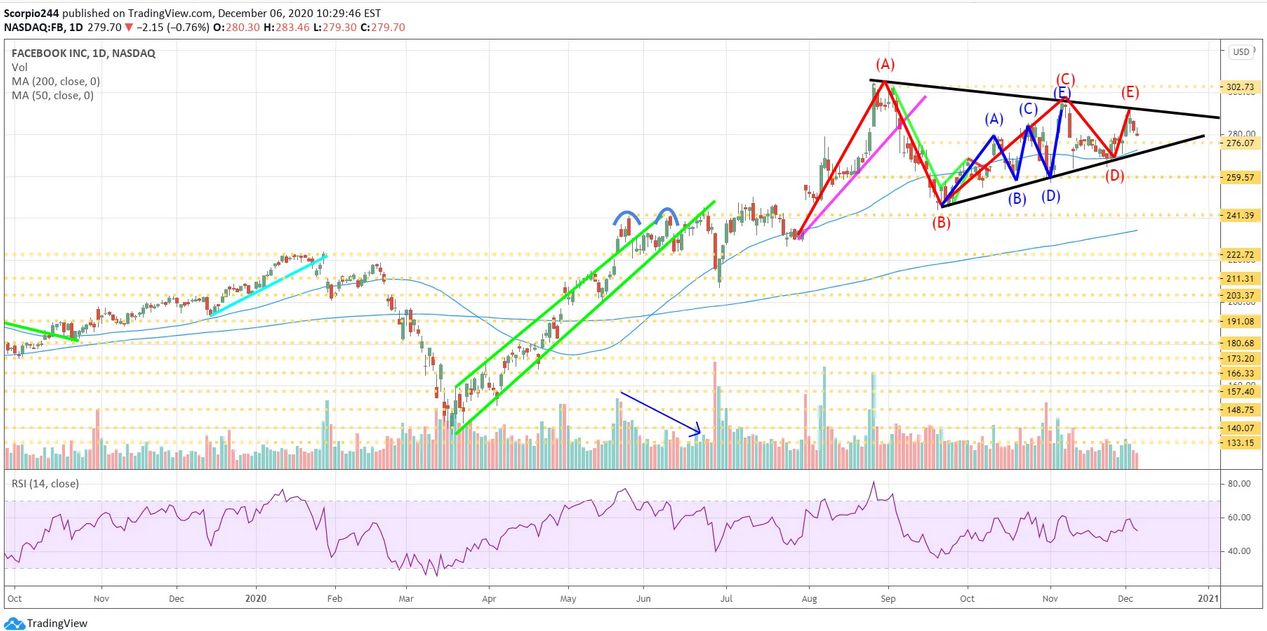
Facebook (NASDAQ:FB) also has a similar triangle pattern, which has formed, and likely suggests the stock pullback to around $260.
I use to enjoy going on Twitter and using it as a source to get news items. Now I can’t stand it; everyone thinks it is a place to post their political views, along with that whole what’s happening section. It isn’t, and quite honestly, I’m sick of the whole thing. I don’t follow market news columnist for them to retweet their political biases. So I unfollow them and find I myself using the platform a lot less, and I’m not even missing anything. It tells me it is a useless platform.
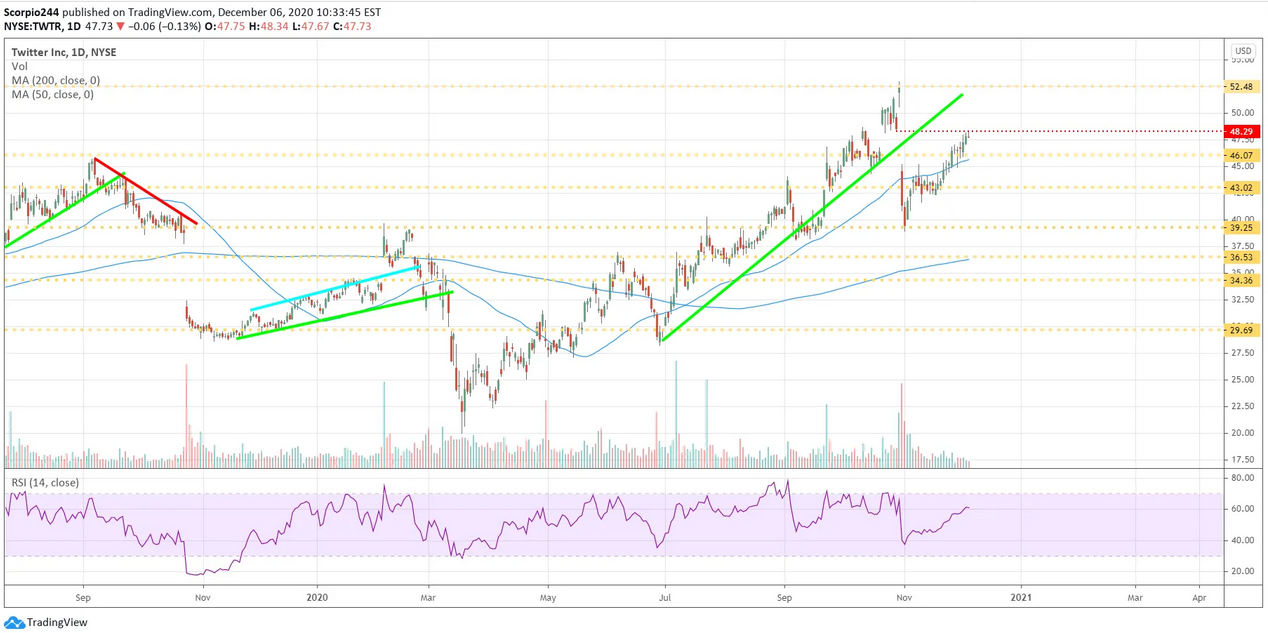
Hopefully, now that the gap is filled, it means the stock heads down again.
AT&T
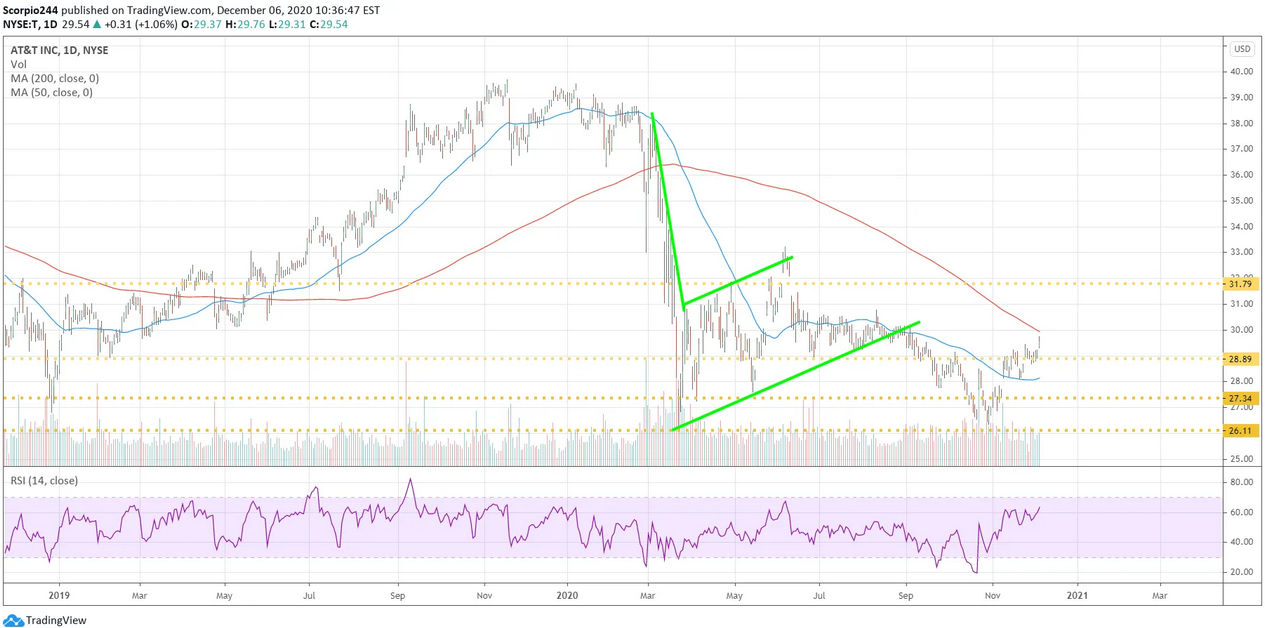
The worst thing AT&T (NYSE:T) did was buy Time Warner. I’ll admit that I thought it was a great idea at the time; it turned out to be a horrible deal. Now they are left with a bloated balance sheet due to all the debt and news networks they can’t even give away. 92% of the S&P 500 is above their 200-day moving average, and AT&T is one of the 8% that isn’t, pretty pathetic. The 200-day will continue to act as tough resistance for the stock.
Time Warner has now been part of the two biggest deal failures ever, AOL and AT&T. Maybe AT&T should sell the unit to Twitter.
Which stock should you buy in your very next trade?
AI computing powers are changing the stock market. Investing.com's ProPicks AI includes 6 winning stock portfolios chosen by our advanced AI. In 2024 alone, ProPicks AI identified 2 stocks that surged over 150%, 4 additional stocks that leaped over 30%, and 3 more that climbed over 25%. Which stock will be the next to soar?
Unlock ProPicks AI
