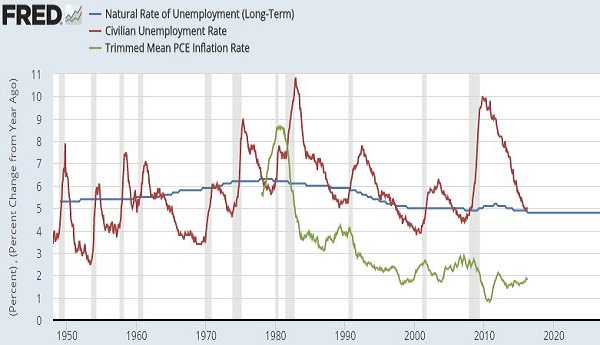
Full employment is widely accepted to be the point where the non-employed worker pool has declined as far as it can without fueling inflation.
Follow up:
I have enjoyed listening to the pundits respond to Donald Trump's unemployment assertions last week.
We have tremendous deficits. Don't believe the 5 percent. The real [unemployment] number is 20 percent.
I do not believe the real unemployment is 5%. This is opinion because the data gathering methods are flawed, real hard data is literally non-existent, and the existing Current Population Survey plainly asks the wrong questions to determine if someone is in the workforce. [One cannot be counted as unemployed if they are not in the workforce]
- Do you currently want a job, either full or part time?
- What is the main reason you were not looking for work during the last 4 weeks?
- Did you look for work at any time during the last 12 months?
- Last week, could you have started a job if one had been offered?
To me, you should simply ask people who do not have a job if they would work if a good job was offered. This way you potentially better understand employment slack (although this is not perfect either). It is very important for organizations (say the Federal Reserve or other government organizations) to correctly access employment slack.
From the meager data published, I continue to focus on the 25 to 54 age group which is the backbone of the USA labor force. The last time this group was the same size as today - which happens to be in January 2000 - the unemployment rate for this segment was 3.1 then, and it is 5.6 now. This equates to 2.5 million workers who are not working - and are likely available for work. At the current rate of employment growth of this group, it would take 2 years to employ 2.5 million 25 to 54 workers.
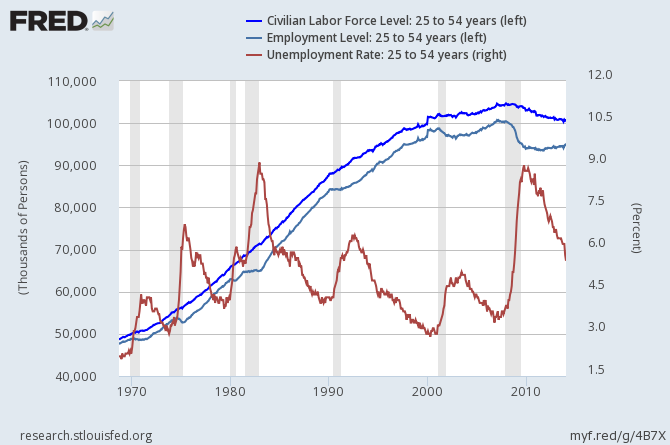
The above graph uses headline unemployment numbers (aka U-3 unemployment) which few believe are an accurate representation of employment slack. Part of the problem is that the U-3 does NOT include discouraged workers. In 1994, the BLS changed the way in which it counted discouraged workers. Per the BLS:
Discouraged workers are a subset of persons marginally attached to the labor force. The marginally attached are those persons not in the labor force who want and are available for work, and who have looked for a job sometime in the prior 12 months, but were not counted as unemployed because they had not searched for work in the 4 weeks preceding the survey. Among the marginally attached, discouraged workers were not currently looking for work specifically because they believed no jobs were available for them or there were none for which they would qualify.
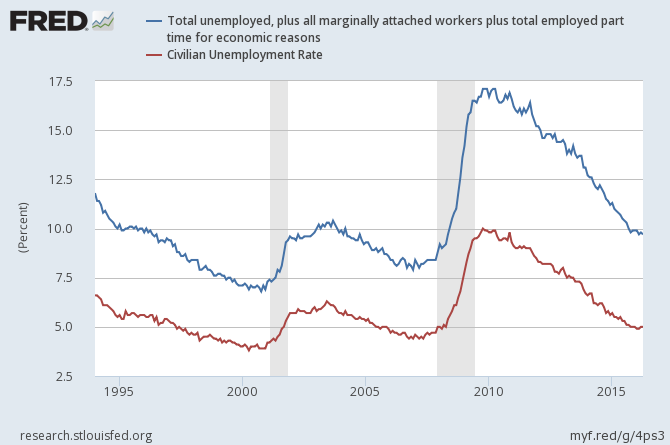
The blue line in the above graph is the U-6 Total unemployed, plus all persons marginally attached to the labor force, plus total employed part time for economic reasons, as a percent of the civilian labor force plus all persons marginally attached to the labor force. The U-6 is currently 9.7% - nearly double the headline unemployment rate - but in the normal range for periods of economic expansion.
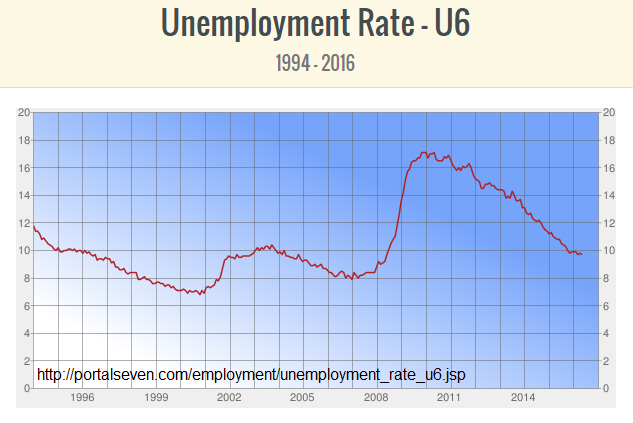
Fortunately this is not my first day on earth - I find it very unlikely that the U-6 unemployment is currently in a normal range seen in the last 20 years. I am not suggesting that there is a conspiracy - just methodology issues. One reason the U-6 is so low is that the number of the population in university has nearly doubled in 10 years - which could add 10% or more to a potential workforce.
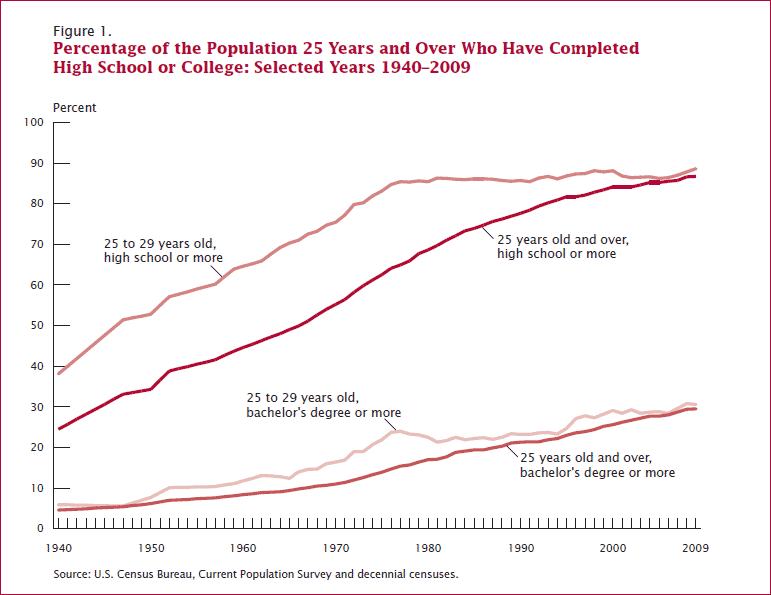
People are entering higher education because good paying jobs do not exist without "papers". So when you try to find historical perspective, one also has to understand the difference in dynamics between periods of time.
It is not unemployment per se which is the issue - but employment slack. Employment slack is a measure of the quantity of non-employed people which can become employed. This slack group includes retirees, students, house-husbands, and some of the people on disability. There is a lot of slack in the economy reflected by the size of the slack in employment.
It is easy to believe employment slack could be 20% of a potential U.S. workforce.
One added note: During most of the 1990's the U-3 unemployment rate was trending down reaching monthly lows around 3% and annual averages around 4% in both 1999 and 2000. The minimum unemployment rate that will not produce inflation is a theoretical notion called NAIRU ( non-accelerating inflation rate of unemployment). The concept was developed by Milton Friedman in 1968, by analogy to the Knut Wicksell concept of "natural" rate of interest. (Wicksellian theory on the effect of interest rates on the economy, and inflation in particular, has been severely challenged in the 21st century.)
For the past 20 years NAIRU has been "theorized" to be between 4.8% and 5.5%. As shown in the graph, low unemployment has been associated with PCE (personal consumption and expenditure) inflation (although modestly).
The weak inflationary responses to unemployment rates well below the NAIRI during this period raise one of three possible conclusions:
- The theoretical NAIRU has not been properly estimated;
- The NAIRU theory is defective; or
- The unemployment rate is not properly calculated.
I cannot rule out any of these - perhaps all three apply. But it does point put one more possible reason why the way unemployment is being measured could be improved.
Other Economic News this Week:
The Econintersect Economic Index for June 2016 marginally dropped into contraction. The index is at the lowest value since the end of the Great Recession. Note that an industrial output, non-monetary data set used to build the index has been swapped as the previous set became too volatile for accurate trending. Reflecting on the potential that a recession is underway (or soon to be underway) - I find the prospect unlikely (but not impossible). It is more likely the economic dynamics have slowed from "muddling along" to a "snails pace". The only group forecasting better economic growth is the self serving forecasts of the Federal Reserve - as well as the components of GDP which do not translate to a better world for those on Main Street. For the near future, one may need a microscope and a micrometer to measure any improvement, but further deterioration is needed to raise our assessment to probable that a recession has or soon will start.
Bankruptcies this Week: Vertellus SpecialtiesVertellus, UCI Holdings Limited, Warren Resources Inc (NASDAQ:WRES)
Click here to view the scorecard table below with active hyperlinks
Weekly Economic Release Scorecard:
