There are only a handful of effective ETFs focused exclusively on biotechnology. Nevertheless, the sector contains companies that will probably produce more effective medical treatment and healthcare than all the insurance plans and HMOs combined.
This is the next big thing for the human race as in the future immunization and cures for disease will allow people to live longer and healthier lives. As an anecdote, a very famous and successful heart surgeon told me a few decades ago that his profession would no doubt be obsolete someday due to advances in biotechnology.
Biotechnology companies are valued more for their future promise than current earnings and sales. This has always been the case making PEs sometimes very high and confusing more uninformed investors. At the same time, when there are clinical trial failures of new drugs or treatments the related company’s shares may plunge significantly. Successful results can lead to dramatic stock gains. One other little known trait is that when earnings from more conventional sectors struggle investors often turn to the biotech sector seeking better performance away from earnings. It may seem an odd pattern but it is something I’ve noticed over more than a few decades.
In fact, since the beginning of 2012, the biotech sector has been one of the better performing areas. This has been due to recent successful clinical trials and a belief that more M&A activity will occur. Established pharmaceutical companies may wish to acquire biotech firms as their pipeline of new drugs weakens. It’s easier and perhaps even cheaper to acquire these firms than to develop their technology from scratch.
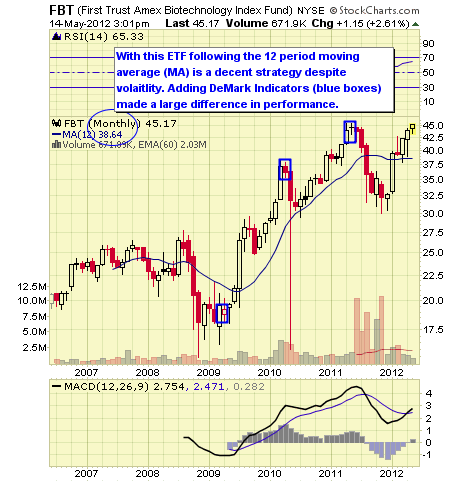
We feature a technical view of conditions from monthly chart views. Simplistically, we recommend longer-term investors stay on the right side of the 12 month simple moving average. When prices are above the moving average, stay long, and when below remain in cash or short. Some more interested in a fundamental approach may not care so much about technical issues preferring instead to buy when prices are perceived as low and sell for other reasons when high; but, this is not our approach.
For traders and investors wishing to hedge, leveraged and inverse issues are available to utilize from ProShares and where available these are noted.![]()
FBT follows the NYSE Arca Biotechnology Index which is an equal dollar weighted index designed to measure the performance of a cross section of companies in the biotechnology industry that are primarily involved in the use of biological processes to develop products or provide services. The fund was launched in June 2006. The expense ratio is 0.60%.
AUM equal $259M and average daily trading volume is 70K shares. As of May 2012 the annual dividend yield is negligible and YTD return 38.21%. The 1YR return was -0.07%.
Data as of May 2012
FBT Top Ten Holdings and Weightings
· Amylin Pharmaceuticals Inc (AMLN): 9.60%
· Regeneron Pharmaceuticals, Inc. (REGN): 6.55%
· Illumina, Inc. (ILMN): 6.37%
· Nektar Therapeutics, Inc. (NKTR): 5.78%
· Alexion Pharmaceuticals, Inc. (ALXN): 5.54%
· Vertex Pharmaceuticals (VRTX): 4.97%
· Incyte Corp Ltd (INCY): 4.91%
· Life Technologies Corp (LIFE): 4.73%
· Myriad Genetics, Inc. (MYGN): 4.68%
· Biogen Idec Inc (BIIB): 4.68%
![]()
PBE follows the Dynamic Biotechnology & Genome Intellidex Index which is designed to provide capital appreciation by thoroughly evaluating companies based on a variety of investment merit criteria, including fundamental growth, stock valuation, investment timeliness and risk factors.
The fund was launched in June 2005. The expense ratio is 0.60%. AUM equal $134M and average daily trading volume is 13K shares. As of May 2012 the annual dividend yield is1.70% and YTD return 9.67%. The 1 YR return was -7.06%.
Data as of May 2012
PBE Top Ten Holdings and Weightings
· Alexion Pharmaceuticals, Inc. (ALXN): 5.38%
· Biogen Idec Inc (BIIB): 5.30%
· Gilead Sciences Inc (GILD): 5.29%
· Waters Corporation (WAT): 5.13%
· Life Technologies Corp (LIFE): 5.02%
· Sigma-Aldrich Corporation (SIAL): 4.93%
· Amgen Inc (AMGN): 4.92%
· Biomarin Pharmaceutical, Inc. (BMRN): 4.80%
· Seattle Genetics, Inc. (SGEN): 3.10%
· Nektar Therapeutics, Inc. (NKTR): 3.03% 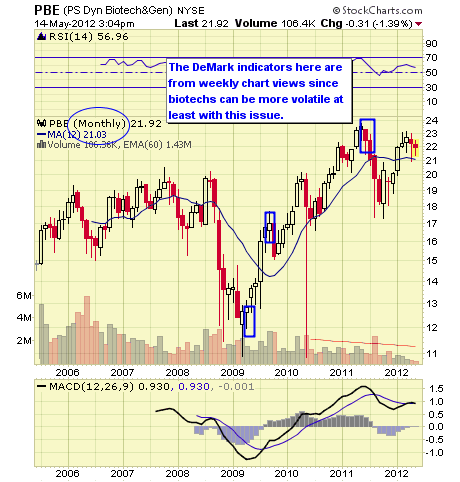
![]()
BBH follows the Market Vectors US Listed Biotech 25 Index which is a rules-based index intended to track the overall performance of 25 of the largest U.S. listed and publicly traded biotech companies. The fund was “relaunched” in December 2011. It is the result of Van Eck taking over control of what previously was the Merrill Lynch HOLDRs which was a trust of securities from 2000. As a trust the previous constituents could not be changed other than if one were assumed by another company or ceased to exist. As a consequence over time some constituents increased dramatically in size and weighting. Frankly BBH was Amgen and little else.
The new index keeps much of the previous weightings as Van Eck from a business view most likely did not want to disrupt previous holders who were content with the way things were. But now we move on and we’ll see how the index changes over time. The expense ratio is 0.35%. AUM equal $106M and average daily trading volume is 42K shares. As May 2012 the annual dividend yield is 1.08% and YTD return 28.33%. The 1 YR return was 32.07% with the latter mostly due to an even heavier weighting in Amgen than currently.
Data as of May 2012
BBH Top Ten Holdings and Weightings
· Amgen Inc (AMGN): 16.49%
· Gilead Sciences Inc (GILD): 9.40%
· Celgene Corporation (CELG): 8.96%
· Biogen Idec Inc (BIIB): 7.60%
· Regeneron Pharmaceuticals, Inc. (REGN): 6.48%
· Alexion Pharmaceuticals, Inc. (ALXN): 5.38%
· Illumina, Inc. (ILMN): 5.30%
· Vertex Pharmaceuticals (VRTX): 5.03%
· Life Technologies Corp (LIFE): 4.45%
· Seattle Genetics, Inc. (SGEN): 3.87%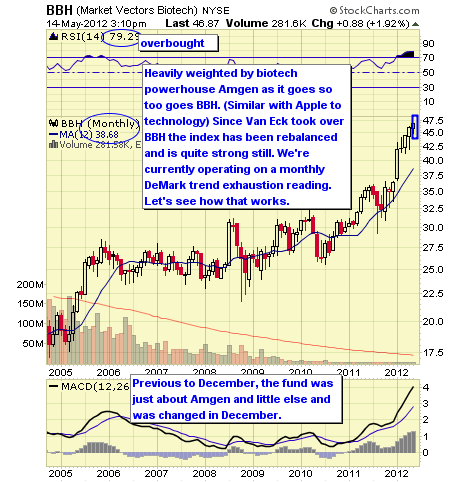
![]()
IBB which follows the NASDAQ Biotechnology Index which contains companies classified as either biotechnology cor pharmaceuticals companies. The fund was launched in May 2001. The expense ratio is 0.48%. Assets under Management (AUM) equal $1,771M and average daily trading volume is 485K shares. As of May 2012 the annual dividend yield is 0.01% and YTD return 21.16%. The 1 YR return was 15.47%.
ProShares has leveraged long and short ETFs for those wishing to speculate or hedge.
Data as of May 2012
IBB Top Ten Holdings and Weightings
· Regeneron Pharmaceuticals, Inc. (REGN): 7.63%
· Amgen Inc (AMGN): 7.38%
· Alexion Pharmaceuticals, Inc. (ALXN): 7.32%
· Celgene Corporation (CELG): 5.83%
· Gilead Sciences Inc (GILD): 5.70%
· Biogen Idec Inc (BIIB): 5.15%
· Teva Pharmaceutical Industries Ltd ADR (TEVA): 4.61%
· Perrigo Company (PRGO): 4.00%
· Vertex Pharmaceuticals (VRTX): 3.23%
· Mylan Inc (MYL): 2.71%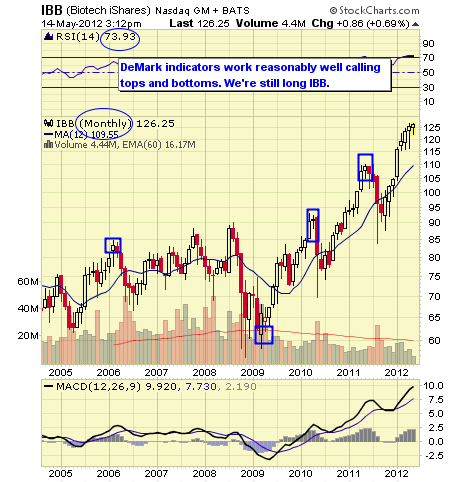
![]()
XBI follows the S&P Biotechnology Select Industry Index which represents the biotechnology sub-industry portion of the S&P Total Markets Index. The S&P TMI tracks all the U.S. common stocks listed on the NYSE, AMEX, NASDAQ National Market and NASDAQ Small Cap exchanges. The Biotech Index is an equal weighted market cap index.
The fund was launched in January 2006. The expense ratio is 0.35%. AUM equal $539M and average daily trading volume is 211K shares. As of May 2012 the annual dividend yield is 0.01% and YTD return 24.37%. The 1 YR return was 11.13%.
Data as of May 2012
XBI Top Ten Holdings and Weightings
· Human Genome Sciences Inc (HGSI): 4.88%
· Amylin Pharmaceuticals Inc (AMLN): 4.48%
· Incyte Corp Ltd (INCY): 3.61%
· Regeneron Pharmaceuticals, Inc. (REGN): 3.44%
· Onyx Pharmaceuticals, Inc. (ONXX): 3.26%
· Dendreon Corp (DNDN): 3.15%
· Gilead Sciences Inc (GILD): 3.08%
· Biogen Idec Inc (BIIB): 3.03%
· Ariad Pharmaceuticals (ARIA): 3.02%
· Seattle Genetics, Inc. (SGEN): 3.01%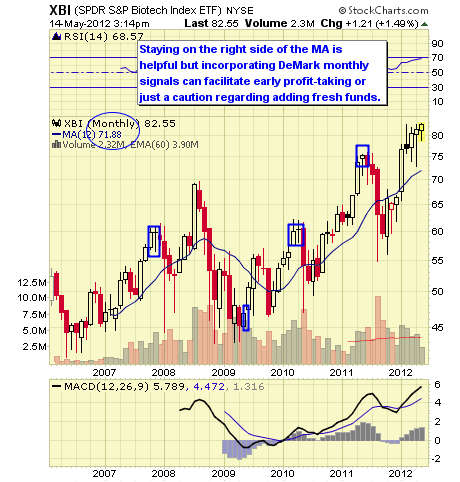
Biotechnology still remains the hope for the future of health care in our opinion. Exposure to them is important, but their inherent volatility makes technical views equally important.
We rank the top 10 ETF by our proprietary stars system as outlined below. However, given that we’re sorting these by both short and intermediate issues we have split the rankings as we move from one classification to another.
Strong established linked index
Excellent consistent performance and index tracking
Low fee structure
Strong portfolio suitability
Excellent liquidity![]()
Established linked index even if “enhanced”
Good performance or more volatile if “enhanced” index
Average to higher fee structure
Good portfolio suitability or more active management if “enhanced” index
Decent liquidity![]()
Enhanced or seasoned index
Less consistent performance and more volatile
Fees higher than average
Portfolio suitability would need more active trading
Average to below average liquidity![]()
Index is new
Issue is new and needs seasoning
Fees are high
Portfolio suitability also needs seasoning
Liquidity below average
It’s also important to remember that ETF sponsors have their own competitive business interests when issuing products which may not necessarily align with your investment needs. New ETFs from highly regarded and substantial new providers are also being issued. These may include Charles Schwab’s ETFs and Scottrade’s Focus Shares which both are issuing new ETFs with low expense ratios and commission free trading at their respective firms. These may also become popular as they become seasoned.
Disclosure: The ETF Digest is long IBB and XBI.
(Source for data is from ETF sponsors and various ETF data providers)
- English (UK)
- English (India)
- English (Canada)
- English (Australia)
- English (South Africa)
- English (Philippines)
- English (Nigeria)
- Deutsch
- Español (España)
- Español (México)
- Français
- Italiano
- Nederlands
- Polski
- Português (Portugal)
- Português (Brasil)
- Русский
- Türkçe
- العربية
- Ελληνικά
- Svenska
- Suomi
- עברית
- 日本語
- 한국어
- 简体中文
- 繁體中文
- Bahasa Indonesia
- Bahasa Melayu
- ไทย
- Tiếng Việt
- हिंदी
5 Top Biotech ETFs
Latest comments
Loading next article…
Install Our App
Risk Disclosure: Trading in financial instruments and/or cryptocurrencies involves high risks including the risk of losing some, or all, of your investment amount, and may not be suitable for all investors. Prices of cryptocurrencies are extremely volatile and may be affected by external factors such as financial, regulatory or political events. Trading on margin increases the financial risks.
Before deciding to trade in financial instrument or cryptocurrencies you should be fully informed of the risks and costs associated with trading the financial markets, carefully consider your investment objectives, level of experience, and risk appetite, and seek professional advice where needed.
Fusion Media would like to remind you that the data contained in this website is not necessarily real-time nor accurate. The data and prices on the website are not necessarily provided by any market or exchange, but may be provided by market makers, and so prices may not be accurate and may differ from the actual price at any given market, meaning prices are indicative and not appropriate for trading purposes. Fusion Media and any provider of the data contained in this website will not accept liability for any loss or damage as a result of your trading, or your reliance on the information contained within this website.
It is prohibited to use, store, reproduce, display, modify, transmit or distribute the data contained in this website without the explicit prior written permission of Fusion Media and/or the data provider. All intellectual property rights are reserved by the providers and/or the exchange providing the data contained in this website.
Fusion Media may be compensated by the advertisers that appear on the website, based on your interaction with the advertisements or advertisers.
© 2007-2025 - Fusion Media Limited. All Rights Reserved.
