by Clement Thibault
Over the past weeks, one of the tailwinds of the Trump presidential victory has been the decisive shift in sentiment on the financial sector, in particular banking. Indeed, optimism on the future of the big banks keeps growing, on the expectation that the President-elect will try and repeal some aspects of Dodd-Frank, and replace it with a new, more 'bank friendly' bill.
At the same time, similar to the Trump bump, the Federal Reserve has also had a hand in the sector's rally. The Fed has affirmed that it expects to follow through on three rate hikes in 2017 in addition to the one that occurred this past December. Rate hikes will improve bank profitability; thus future earnings for banks have been revised upward, more than previously expected.
Tomorrow JPMorgan Chase (NYSE:JPM), Wells Fargo (NYSE:WFC) and Bank of America (NYSE:BAC) report earnings; Citigroup (NYSE:C) reports on Wednesday. In order to determine which shares from among these four might be the most attractive for investors, we'll look at revenues, profitability, valuation, and future outlook.
Revenue

When comparing growth numbers, above, JPMorgan and Wells Fargo have a distinct advantage over the stagnating BofA and shrinking Citigroup. However, to get a better understanding of the business itself, one needs to look at the two segments—Non-Interest Revenue and Interest Revenue—separately.
As the name indicates, Non-Interest Revenue refers to all revenue earned without relying on interest rates, for example credit card membership fees, brokerage fees, and trading revenue. Looking at the mix of a bank's revenue sources helps an investor understand what are the institutions strengths and weaknesses.
All the banks we're considering have seen declines in their non-interest related income except for Wells Fargo. The biggest stream of non-interest related revenue comes from commissions from assets under management and investment activities—accounting for about 30% of each bank's revenue. These have declined across the board.
Wells Fargo's growth largely comes from its leasing operation: business equipment including machinery, trucks, even airplanes. This has tripled and added more than a billion dollars in revenue from last year.
Interest revenue has grown at three of the four major banks, with Citigroup the odd man out. Each of the three other banks have capitalized on higher rates and loan growth, which will grow further with interest rate hikes from the Federal Reserve (should they occur). Citigroup's revenue, while pushed higher by favorable conditions in the US, was down more than 10% in Latin America, and by $1.5 billion in the to-be-eliminated Citi Holdings division, the umbrella segment for all of C's non-core businesses including subsidiaries such as smaller subprime lending companies. Citigroup is divesting these businesses as it tries to refocus on its core bank business while also simplifying its complex organizational structure.
But in order to evaluate interest-related revenue, one must take into account the quality of the loan as well (chart below). A loan not repaid is a direct loss for the bank, and though most of the time banks do get their money back, it is critical for each bank to improve its risk assessment in order to cut down on nonperforming loans.
In that respect, we can see that JP Morgan leads the pack, with only 0.88% of its loans nonperforming. Wells Fargo, on the other hand, is the only bank with over 1% of nonperforming loans, at 1.25%. However, all four banks have managed to cut back on the percentage of nonperforming loans, an important metric of quality of assets the bank possesses.

As far as revenue is concerned, both in quantity, quality, and growth, JP Morgan is well ahead of the pack. Citigroup, busy with structural realignment, is seeing a negative impact to its income statement from the changes. Wells Fargo is growing but appears to be the biggest risk taker. Bank of America falls somewhere in between.
Profitability
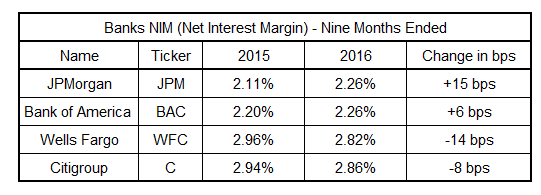
Net interest margin (NIM) is a metric used to track a bank's lending and investing profitability. The metric is calculated by dividing net interest income by average interest-earning assets. It indicates how effectively banks are using the funds at their disposal.
Since there are fundamental differences in asset allocation strategies from year-to-year, this metric makes it simpler to compare performance in different years at the same bank.

Over the past year, both JP Morgan and Bank of America have managed to grow their NIM, which suggests that management has adeptly navigated the thin balance between the rate given to depositors and the lending rate. As the world steps away from a zero interest rate environment, which has put pressure on interest rate margins, this metric should improve for all banks. Wells Fargo and Citigroup, with historically higher margins, have both lost some ground.
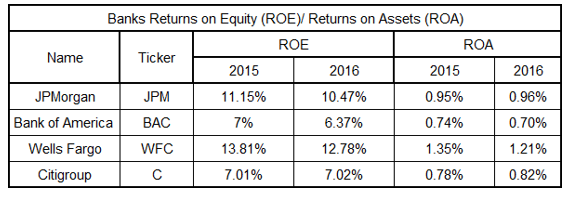
Two other important profitability metrics are Return-on-Equity (ROE) and Return-on-Assets (ROA). While the Net Interest Margin indicates the profitability of the interest-related portion of each institution's revenue, ROE and ROA provide the big picture view of the effectiveness of each bank's overall use of assets—including loans, assets, real estate holdings...in short, absolutely everything on the balance sheet—and equity refers to profit generated by shareholder investment ie the value of its shares. Keep in mind that banks are very asset heavy and therefore held to a lower standard compared with other industries since the bank business is inherently capital intensive, compared to other businesses that are more technology/information oriented.

As a rule, a Return-on-Equity of 10% is expected, while a Return-on-Assets of 1.5% is considered satisfactory for banks. As the table above shows, only JP Morgan and Wells Fargo are able to meet the 10% standard, while none of the banks are providing a Return-on-Assets of 1.5%.
All things considered, Wells Fargo leads in the profitability category. It has the highest ROE and ROA and the second best NIM. However, its shrinking lead is cause for concern; JP Morgan managed to grow interest margins and ROA.
Valuation
Three metrics are useful for determining appropriate pricing of bank stocks. Price-to-Book ratio indicates the differential between how the market values the stock versus the book value of the company. Since bank assets are usually priced at market value, a ratio above 1 signals investor trust in the company's ability to grow. A ratio below 1 signals the market believes the company's assets are overstated, or that its liabilities are understated.
Tangible-Book-Value is a similar metric, though it doesn't take into account intangible assets such as intellectual property or goodwill, thus representing more accurately the real amount an investor would receive if the bank were to cease operations and liquidate assets. The Price-to-Earnings ratio indicates the market's confidence in the future profitability of the institution, but should be considered as secondary to Book Value when dealing with banks.

Wells Fargo is the most highly valuated stock according to its Price-to-Book ratio, followed by JP Morgan, Bank of America, and Citigroup. These findings are consistent with our analysis so far, and show no obvious discrepancy in each bank's share price.
Conclusion
Wells Fargo is currently benefiting from a higher valuation because of its historically superior profitability. However, the recent profitability trend for Wells is down.
In addition, the bank has been entangled in a web of high-profile scandals of late, including fraudulent account openings by employees trying to reach management's aggressive sales targets. The practice—and hopefully the problem—have have been eliminated.
Unfortunately, the brand has taken a direct hit, as is clear from a study conducted by consulting firm cg42, which found that of 1,500 customers looking for a bank to do business with, 52% now have a negative perception of the bank, quit a jump from 15% that thought poorly of the bank before the scandal broke. Of perhaps greater significance, 54% of those surveyed said they would not join the bank, compared to 12% and 22% prior to the scandal.
New accounts established have been falling by tens of percentages as well. However, thanks to the post-election rally, the bank's valuation is now back to its pre-scandal levels.
From our perspective, JP Morgan, headed by CEO Jamie Dimon, who is perceived to be one of the best and most stable bank CEOs, is the better investment. And Dimon doesn't just 'talk-the-talk.' This past February he also 'walked-the-walk,' buying $26 million of JPM shares at their low ($53 then, now worth $86).
Market and analyst perception is that he actually believes in the business and doesn't just run it for a paycheck, which is a rarity. Heading into an era of higher interest rates, with almost all of its important metrics improving, JPM makes the most sense for both short and longer term investors. The problematic profitability of Bank of America and Citigroup is a good enough reason to stay away.
