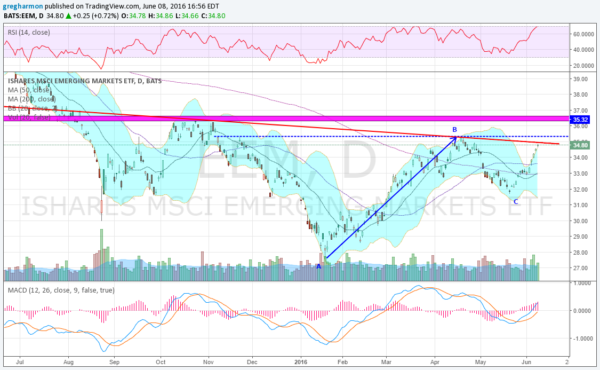
The US stock market has been on fire since the February low. But it is not the only place where investors and traders have been looking to make money. Many foreign markets and even the Emerging Markets have been doing well. Focusing on Emerging Markets, the ETF that tracks them (iShares MSCI Emerging Markets (NYSE:EEM)) is up over 25% since making a low in late January.
The rise to a high in April and then the pullback to a higher low gives promise for more upside. It creates a target of 43 should it continue over point B to complete an AB = CD pattern. But to get there it will need to overcome 5 potential roadblocks found in the chart below.

First there is the falling red line, the neckline of a possible Inverse Head and Shoulders. This could act as resistance, or a move above reinforces the AB=CD target with a price objective to at least 43. Next is the dotted blue line at 35.30, resistance that has held since November.
Third is the thick magenta line. This area has been long term support and resistance over the past 6 years. The zone from 36 to 37 has been very important. Next is the momentum indicators. The RSI is bullish and rising but entering into overbought territory. The MACD is rising. Finally a look at the Bollinger Bands® shows 4 closes in a row outside of the upper band.
One or all or none of these factors may play a role. What is interesting is that they are all showing some form of a possible stall or reversal within a 2.5 point range. That is pretty tight for so many possible resistance areas to show up. Another way to look at that is if the EEM can get through all that, it is really showing strength. As always, until it fails the current trend is up and that is how you should position.
The information in this blog post represents my own opinions and does not contain a recommendation for any particular security or investment. I or my affiliates may hold positions or other interests in securities mentioned in the Blog, please see my Disclaimer page for my full disclaimer.
