-
Today, we'll explore stocks offering promising dividends alongside potential growth opportunities and market favor.
-
These stocks embody a coveted blend of strong dividends, promising earnings, market backing, and trading below their intrinsic worth.
-
Join us as we uncover these promising investment opportunities meeting all four essential criteria.
- If you invest in stocks and want to get the most out of your portfolio, try InvestingPro. Sign up HERE for less than $10 per month and take advantage of up to 38% off your 1-year plan for a limited time!
Investing in stocks solely based on a high dividend yield isn't wise. Instead, look for companies that have the following qualities:
- Their dividend yield is higher than the inflation rate.
- They have promising prospects for their corporate performance.
- Their stock price is lower than their intrinsic value.
- They have strong market support.
During my market research, I discovered a select group of companies that offer a dividend yield of over 6% and also fulfill these criteria. Let's explore four such stocks:
1. Altria Group (MO)
Altria Group (NYSE:MO) owns the Marlboro brand and bought Kraft Foods (NASDAQ:KHC) (food) in 1988. It was founded in 1822 and is headquartered in Richmond, Virginia.
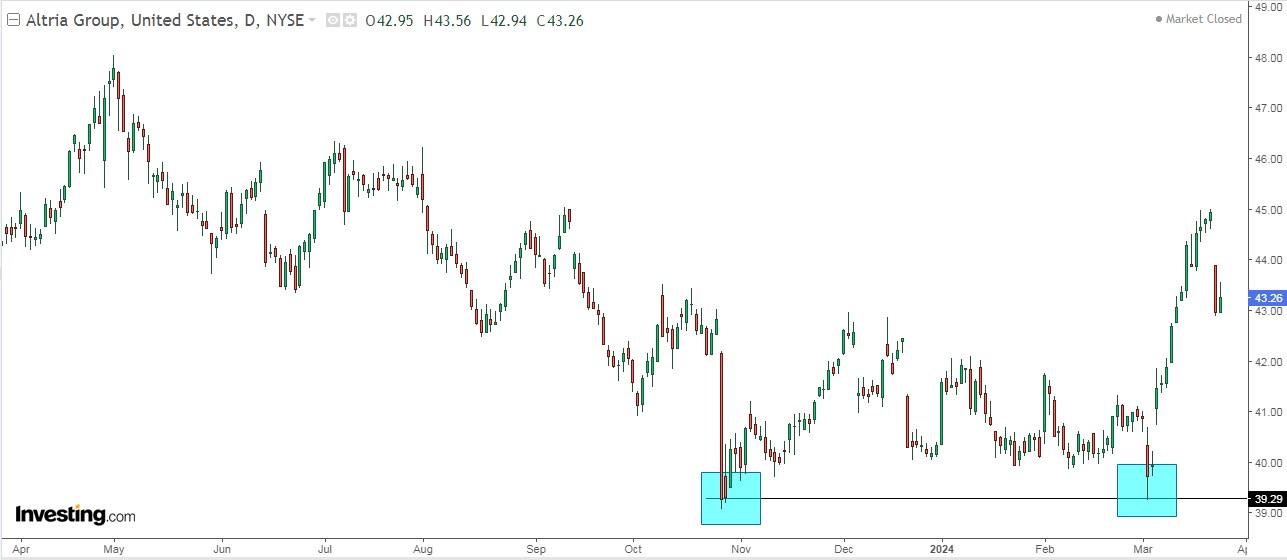
Its dividend yield is +8.75% (up from +9.8%). It is one of the highest yields within the S&P 500.
On April 25, it presents its results and EPS growth is expected in 2024 and 2025.
Altria announced the sale of shares of Anheuser-Bush InBev (ABI) for US$200 million. The company intends to use the proceeds to enhance shareholder returns by adding $2.4 billion to its new share repurchase program.
It also continues to generate strong cash flow, $9.3 billion, with moderate capital spending.
InvestingPro models assign it a price target at $53.18.
2. Healthpeak Properties
Healthpeak Properties Inc (NYSE:DOC) invests in real estate in the healthcare industry sector, including senior housing, life sciences and medical offices.
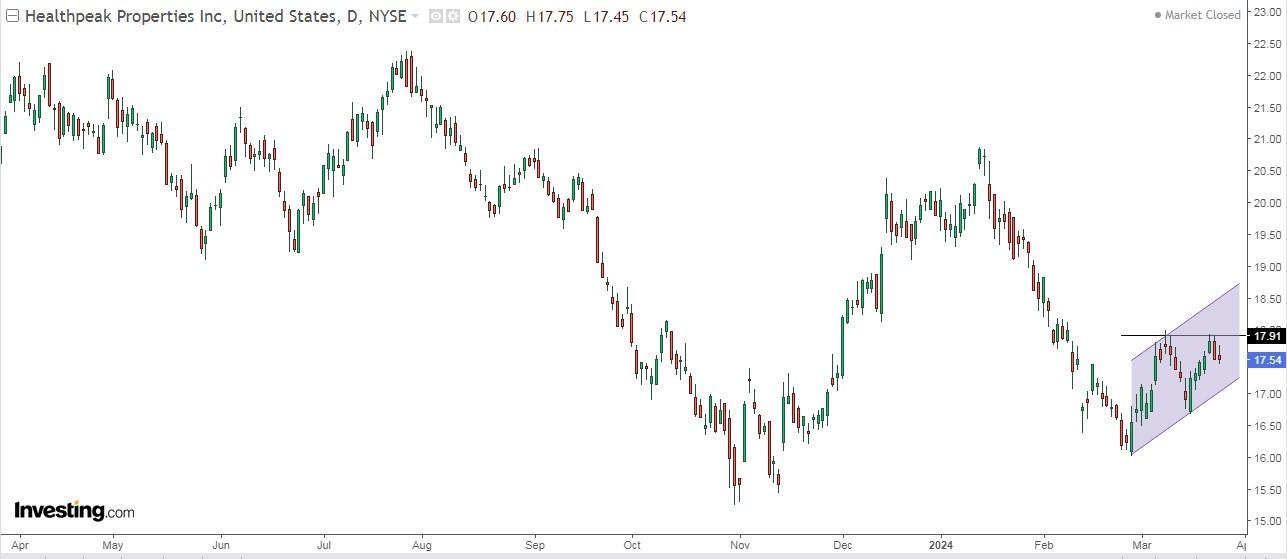
It was established in 1985 and is headquartered in Denver, Colorado. In October 2019, the company changed its name to its current name. In 2008, it became part of the S&P 500.
It has a dividend yield of +6.65%.
On April 30, it presents its accounts. By 2024 it expects a revenue increase of +25.6%.
In its favor it has a solid balance sheet composition and a stable financial outlook influenced by possible synergies from the latest merger.
The market assigns it a potential at $20.23.
3. Verizon Communications
Verizon Communications Inc (NYSE:VZ) was founded in 1983 as Bell Atlantic, based in New York. It emerged as part of the 1984 breakup of AT&T.
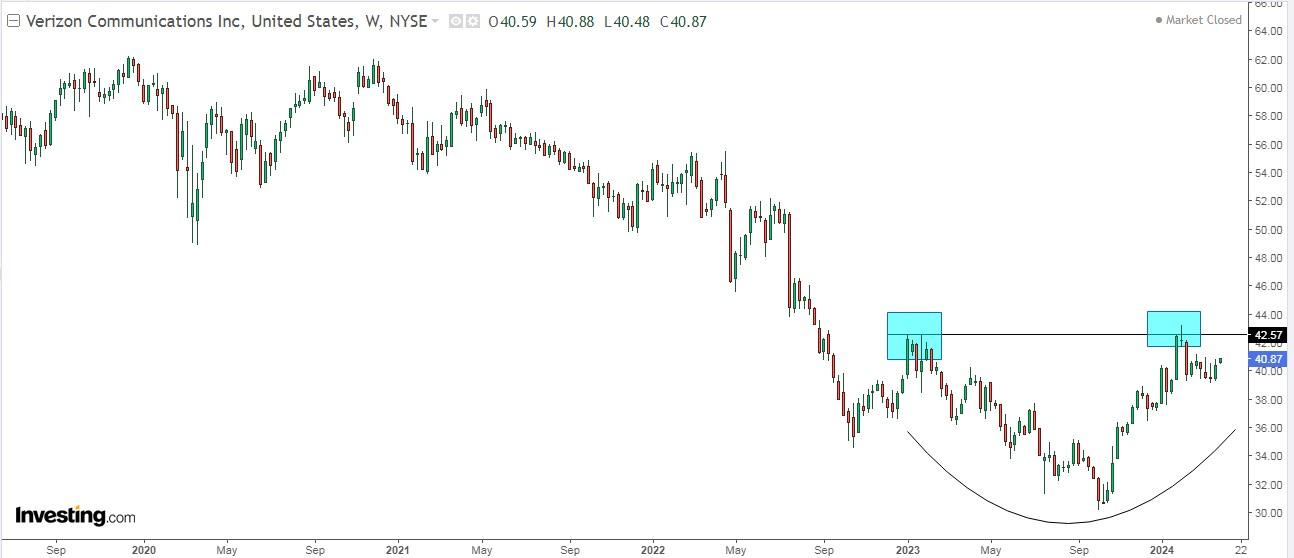
On June 30, 2000 Bell Atlantic acquired GTE and changed its name to Verizon Communications. It is engaged in the provision of communications, technology, information and entertainment products and services.
Its dividend yield is +6.63%. On May 1 it distributes 0.66 dollars and in order to be entitled to it it is necessary to hold shares before April 9.
On April 22 it will report its results and is expected to increase revenues in 2024 and 2025.
Verizon may benefit from lower interest rates as a significant portion of its debt, approximately 26%, is subject to variable interest rates.
It has 27 ratings, of which 14 are buy, 12 are hold and 1 is sell.
The market sees potential at $44.36.
4. Kinder Morgan
Kinder Morgan (NYSE:KMI) was formerly known as Kinder Morgan Hold and changed its name to Kinder Morgan in February 2011. It was founded in 2006 and is headquartered in Houston, Texas.
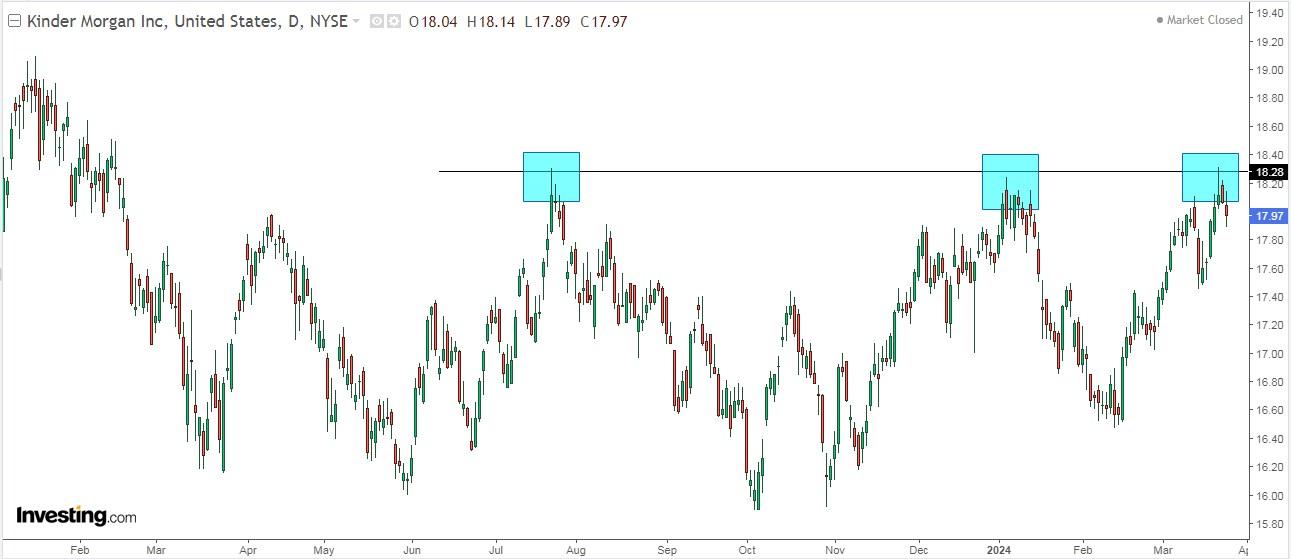
Its dividend yield is +6.26%.
On April 17 we will see its numbers. For 2024 the forecast is for an EPS increase of +13.4% and revenues of +16.2%.
In its favor it has $3 billion in projects.
It has 22 ratings, of which 9 are buy, 12 are hold and 1 is sell.
The potential assigned by the market would be at $17.5.
5. Boston Properties
Boston Properties (NYSE:BXP) has real estate that it manages for workplaces in Boston, Los Angeles, New York, San Francisco, Seattle and Washington. It was founded in 1970 and went public in 1997.
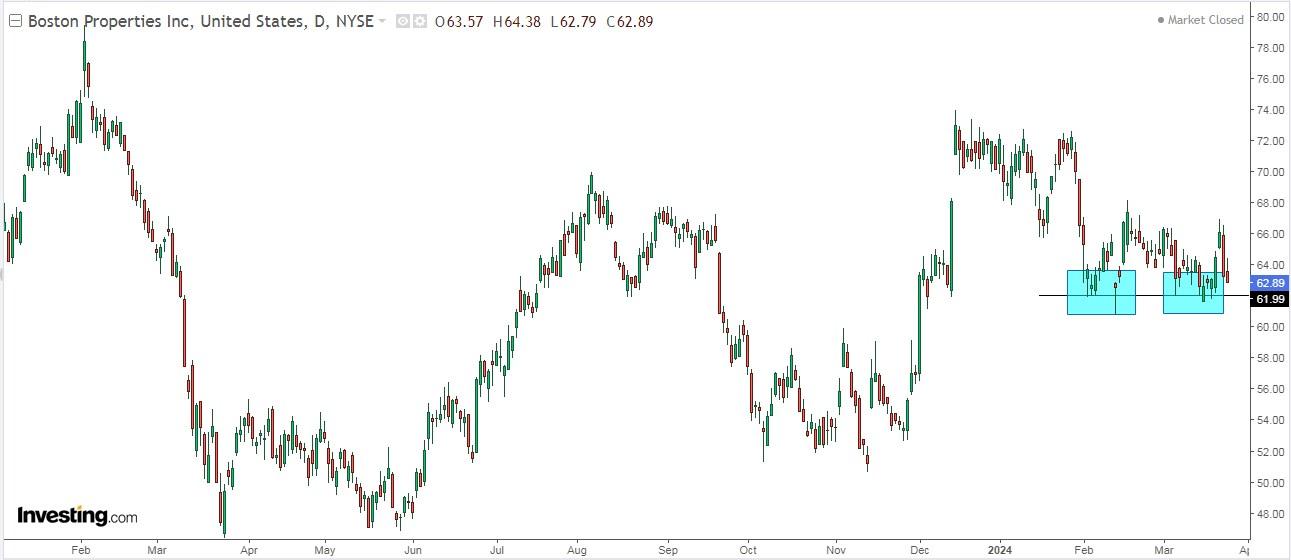
Its dividend yield is +6.10%. It will pay out $0.98 on April 30, and to be eligible to receive it, shares must be held before March 27.
April 29 is the date for the presentation of its accounts. Revenue growth is expected in 2024 and 2025.
BXP's portfolio as of December 31, 2023 included 188 properties, 10 of which are under construction or redevelopment.
The company intends to have a significant presence in the real estate market; it has been doing so for 50 years and intends to increase its weight.
The company's revenue growth over the past twelve months was +4.71%, reflecting its ability to expand its revenue streams effectively. In addition, the company's gross profit margin of 62.29% underscores its efficiency in managing operating costs.
The market sees potential at $72.58 from Monday's close of $62.89. But InvestingPro models see even greater potential at $80.71.
***
Are you investing in the stock market? To determine when and how to get in or out, try InvestingPro.
Take advantage HERE & NOW! Click HERE, choose the plan you want for 1 or 2 years, and take advantage of your DISCOUNTS.
Get from 10% to 50% by applying the code INVESTINGPRO1. Don't wait any longer!
With it, you will get:
- ProPicks: AI-managed portfolios of stocks with proven performance.
- ProTips: digestible information to simplify a large amount of complex financial data into a few words.
- Advanced Stock Finder: Search for the best stocks based on your expectations, taking into account hundreds of financial metrics.
- Historical financial data for thousands of stocks: So that fundamental analysis professionals can delve into all the details themselves.
- And many other services, not to mention those we plan to add in the near future.
Act fast and join the investment revolution - get your OFFER HERE!
Disclaimer: The author does not own any of these shares. This content, which is prepared for purely educational purposes, cannot be considered as investment advice.

