Retailers have had a lukewarm start to fiscal 2016 with many traditional brick-and-mortar operators reporting lower-than-expected results, in spite of the conservative estimates.
However, among retailers, discount retail stocks rake in high yields and stable returns. Moreover, in this era of value-driven consumers, particularly Millennials, discount retailers are much in favor as they offer goods at bargain prices.
Discount retailer TJX Companies Inc. (NYSE:TJX) is therefore an intriguing investment pick for now.
With a market cap of $50.6 billion, the Framingham, MA companyenjoys a broad geographic presence and product diversity as well as strong growth potential.
What Makes TJX a Profitable Pick
VGM Score: TJX carries a VGM score of B. Here “V” stands for Value, “G” for Growth and “M” for Momentum and the score is the weighted combination of these metrics. This allows you to eliminate the negative aspects of stocks and select the ones that are likely to outperform. However, it is important to keep in mind that each Style Score will carry a different weight while arriving at a VGM score.
TJX fares well in the style score system too, with a Growth score of A.
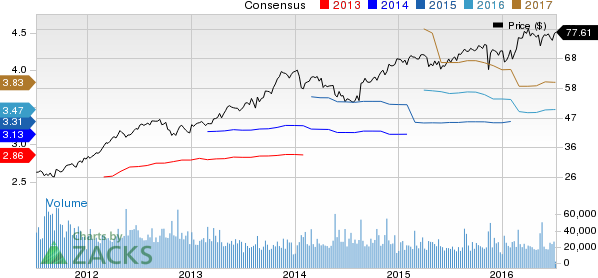
Rank and Estimates: TJX, a Zacks Rank #2 (Buy) stock, has had a good run so far this year, gaining around 8.8%. Over the past 60 days, analysts have become increasingly bullish on the company, with 10 out of 14 estimate revisions moving north for fiscal 2017 earnings.
Results and Outlook: TJX made a solid start to fiscal 2017 with earnings and sales beating estimates in the first quarter despite the foreign exchange impact. The company raised its full-year 2017 guidance to reflect its strong first-quarter results. TJX projects diluted earnings per share in the range of $3.35 to $3.42 compared with the previous estimate of $3.29 to $3.38. The guidance is down 1% to 3% from $3.33 recorded in fiscal 2016. Comparable-store sales are expected to grow 2--3% compared with 1–2% projected earlier.
Comps Growth: TJX has reported positive comps growth in the past 29 quarters. Higher traffic led to the impressive performance. The company’s fresh stock and extensive sourcing machinery have helped it retain a loyal customer base.
Insulated from Brexit: TJX’s flexible model has insulated it from the Brexit tremors that rattled the financial world. The model allows TJX to flow the right merchandise in the right categories at the right time. In spite of its exposure to Europe, the off price apparel retailer is able to maintain its comps with its ever changing stocks.
Other Stocks to Consider
Other stocks in the discount retail sector are Fred’s Inc. (NASDAQ:FRED) , Burlington Stores Inc. (NYSE:BURL) and Dollar General Stores (NYSE:DG) . While Fred’s sports a Zacks Rank #1 (Strong Buy), Burlington Stores and Dollar General carry a Zacks Rank #2.
DOLLAR GENERAL (DG): Free Stock Analysis Report
TJX COS INC NEW (TJX): Free Stock Analysis Report
FREDS INC (FRED): Free Stock Analysis Report
BURLINGTON STRS (BURL): Free Stock Analysis Report
Original post
Zacks Investment Research

