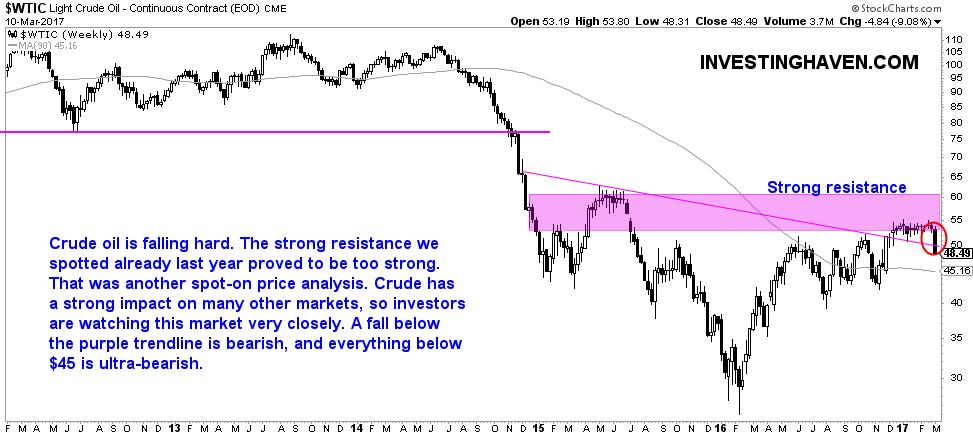
By far the most important market this past week was crude oil. With a mini-crash of 12 percent it could spell the start of a new trend, potentially the start of turmoil in markets, as explained last week in crude oil falls 5%.
It is no coincidence that several other leading commodities are struggling as well, primarily gold and silver, copper and base metals.
However, this should not come as a surprise to our readers. We have spotted current trend reversal price levels many weeks or even months ago.
Nevertheless, we see that leading commodities have rather spectacular charts right now, so it's worth discussing them separately.
1. Crude oil could bring turmoil to global markets
The ongoing mini-crash in crude oil is important because crude is a leading market. Once it starts trending, it has the power to influence all other markets globally. The crude oil crash of 2014 and 2015 is certainly proof of that.
Crude oil was visibly not able to break through resistance. We spotted this resistance area last summer, and since then crude did not succeed in going structurally above $52, which is the lower section of the resistance area seen on the below chart. Our 2017 crude oil price forecast was spot-on.
InvestingHaven’s research team recommends to closely watch what happens in the $45 to $48 price range, as that has an above average importance to markets.
2-3. Precious metals continue their downtrend
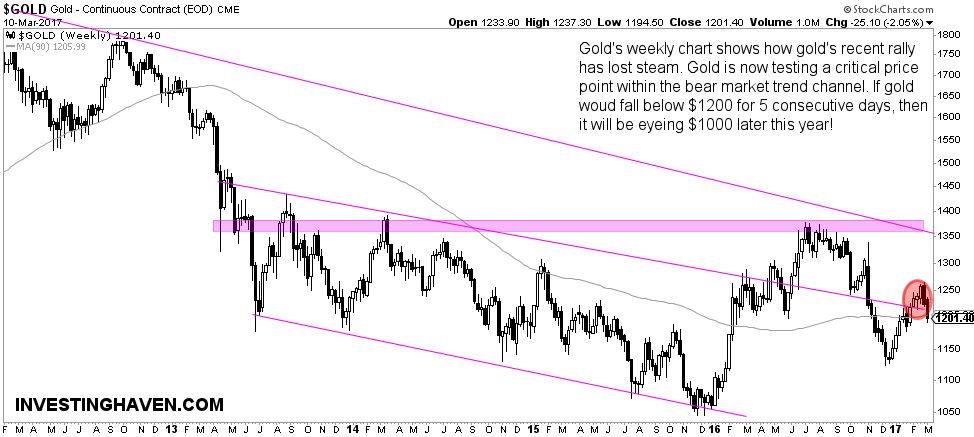
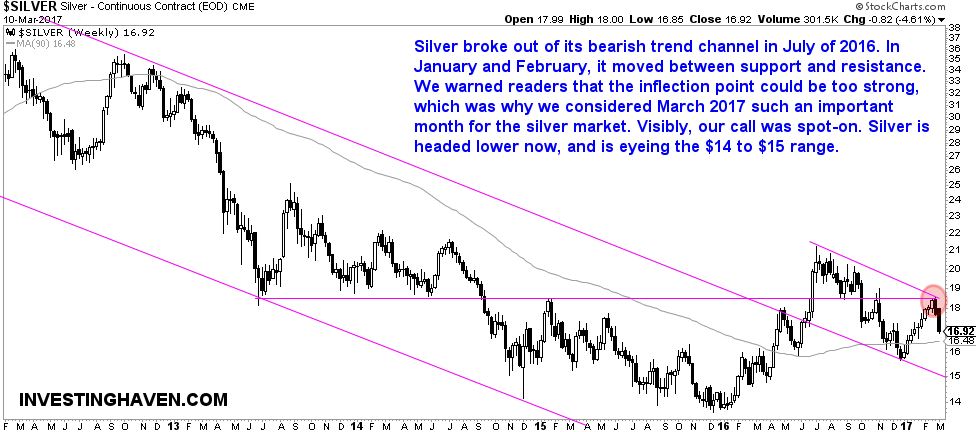
Gold and silver are both suffering as crude oil declines. Note on silver’s chart how the price of silver tested a secular breakout level but was unable to break above it. That happened right at a time when crude oil topped, and when gold was testing the above average important $1250 price level. We spotted the importance of the $1250 gold price many months ago.
Given the current chart structures in both gold and silver, the trend is clearly down. First, because of the fact that both assets are still in a long term bear market. Second, because structural support is way below current price levels.
So far, InvestingHaven’s long term price targets are still in play, as defined many months ago in our 2017 gold forecast and silver forecast 2017.
4. Base metals at critical juncture
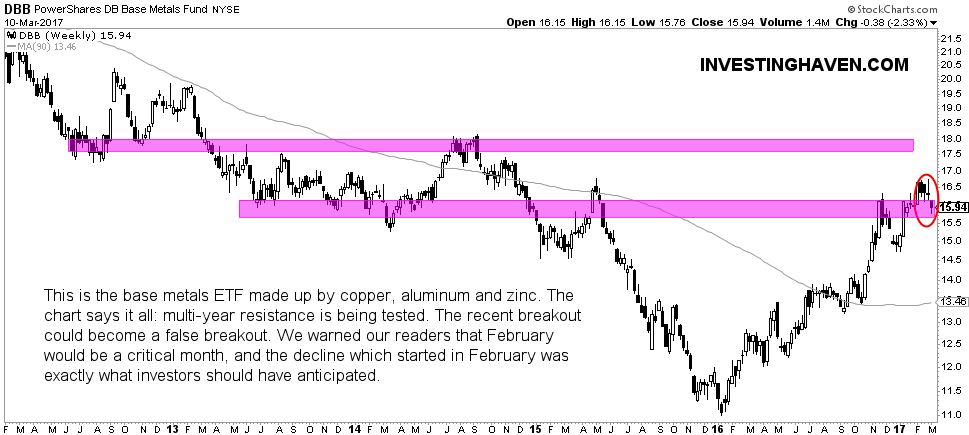
Next, base metals have lost some 10 percent in recent weeks. InvestingHaven’s analysts flashed a warning a while back, explaining why February 2017 was crucial for base metals. The chart structure combined with an above average rise in 2016 were the two reasons to recommend prudence.
The PowerShares DB Base Metals ETF (NYSE:DBB), representing copper, aluminium and zinc, is now trading at a critical juncture. Any break below current levels would be bearish, and below 14.50 would be ultra-bearish.
Specifically to copper investors, we recommend re-reading our copper price forecast for 2017 as the price levels outlined in that article are still very accurate, certainly if copper continues to trend lower. However, if the ongoing decline would stop, copper would enter a bull market once it structurally trades above $2.80.
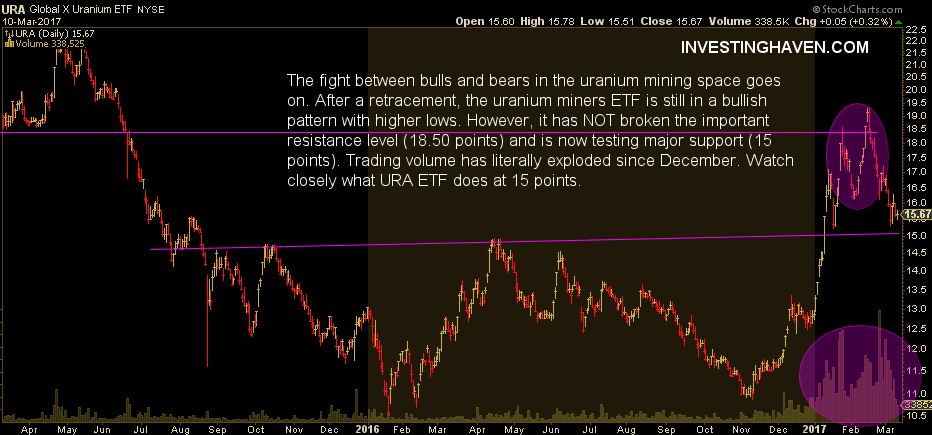
5. Uranium miners testing key breakout
The uranium space is the only one refusing to break down, at least for now. The 15 points level in the Global X Uranium ETF (NYSE:URA), representing the uranium mining space, is by far the most important price level to watch. Note on the URA chart how trading volume has exploded as prices started rising last December. There was bullish momentum in the uranium space, the key question is whether bulls will win the battle. Watch 15 points to get an answer on that question.
